

Sometimes a problem can be hidden deeper than we can see from Slido behavior. You can help us diagnose the issue with the Inspect element report from your browser by following these steps:
- Open your browser on the page you experience the issue at
- Right-click anywhere on the page + choose Inspect (Google Chrome) or Inspect element (other browsers)
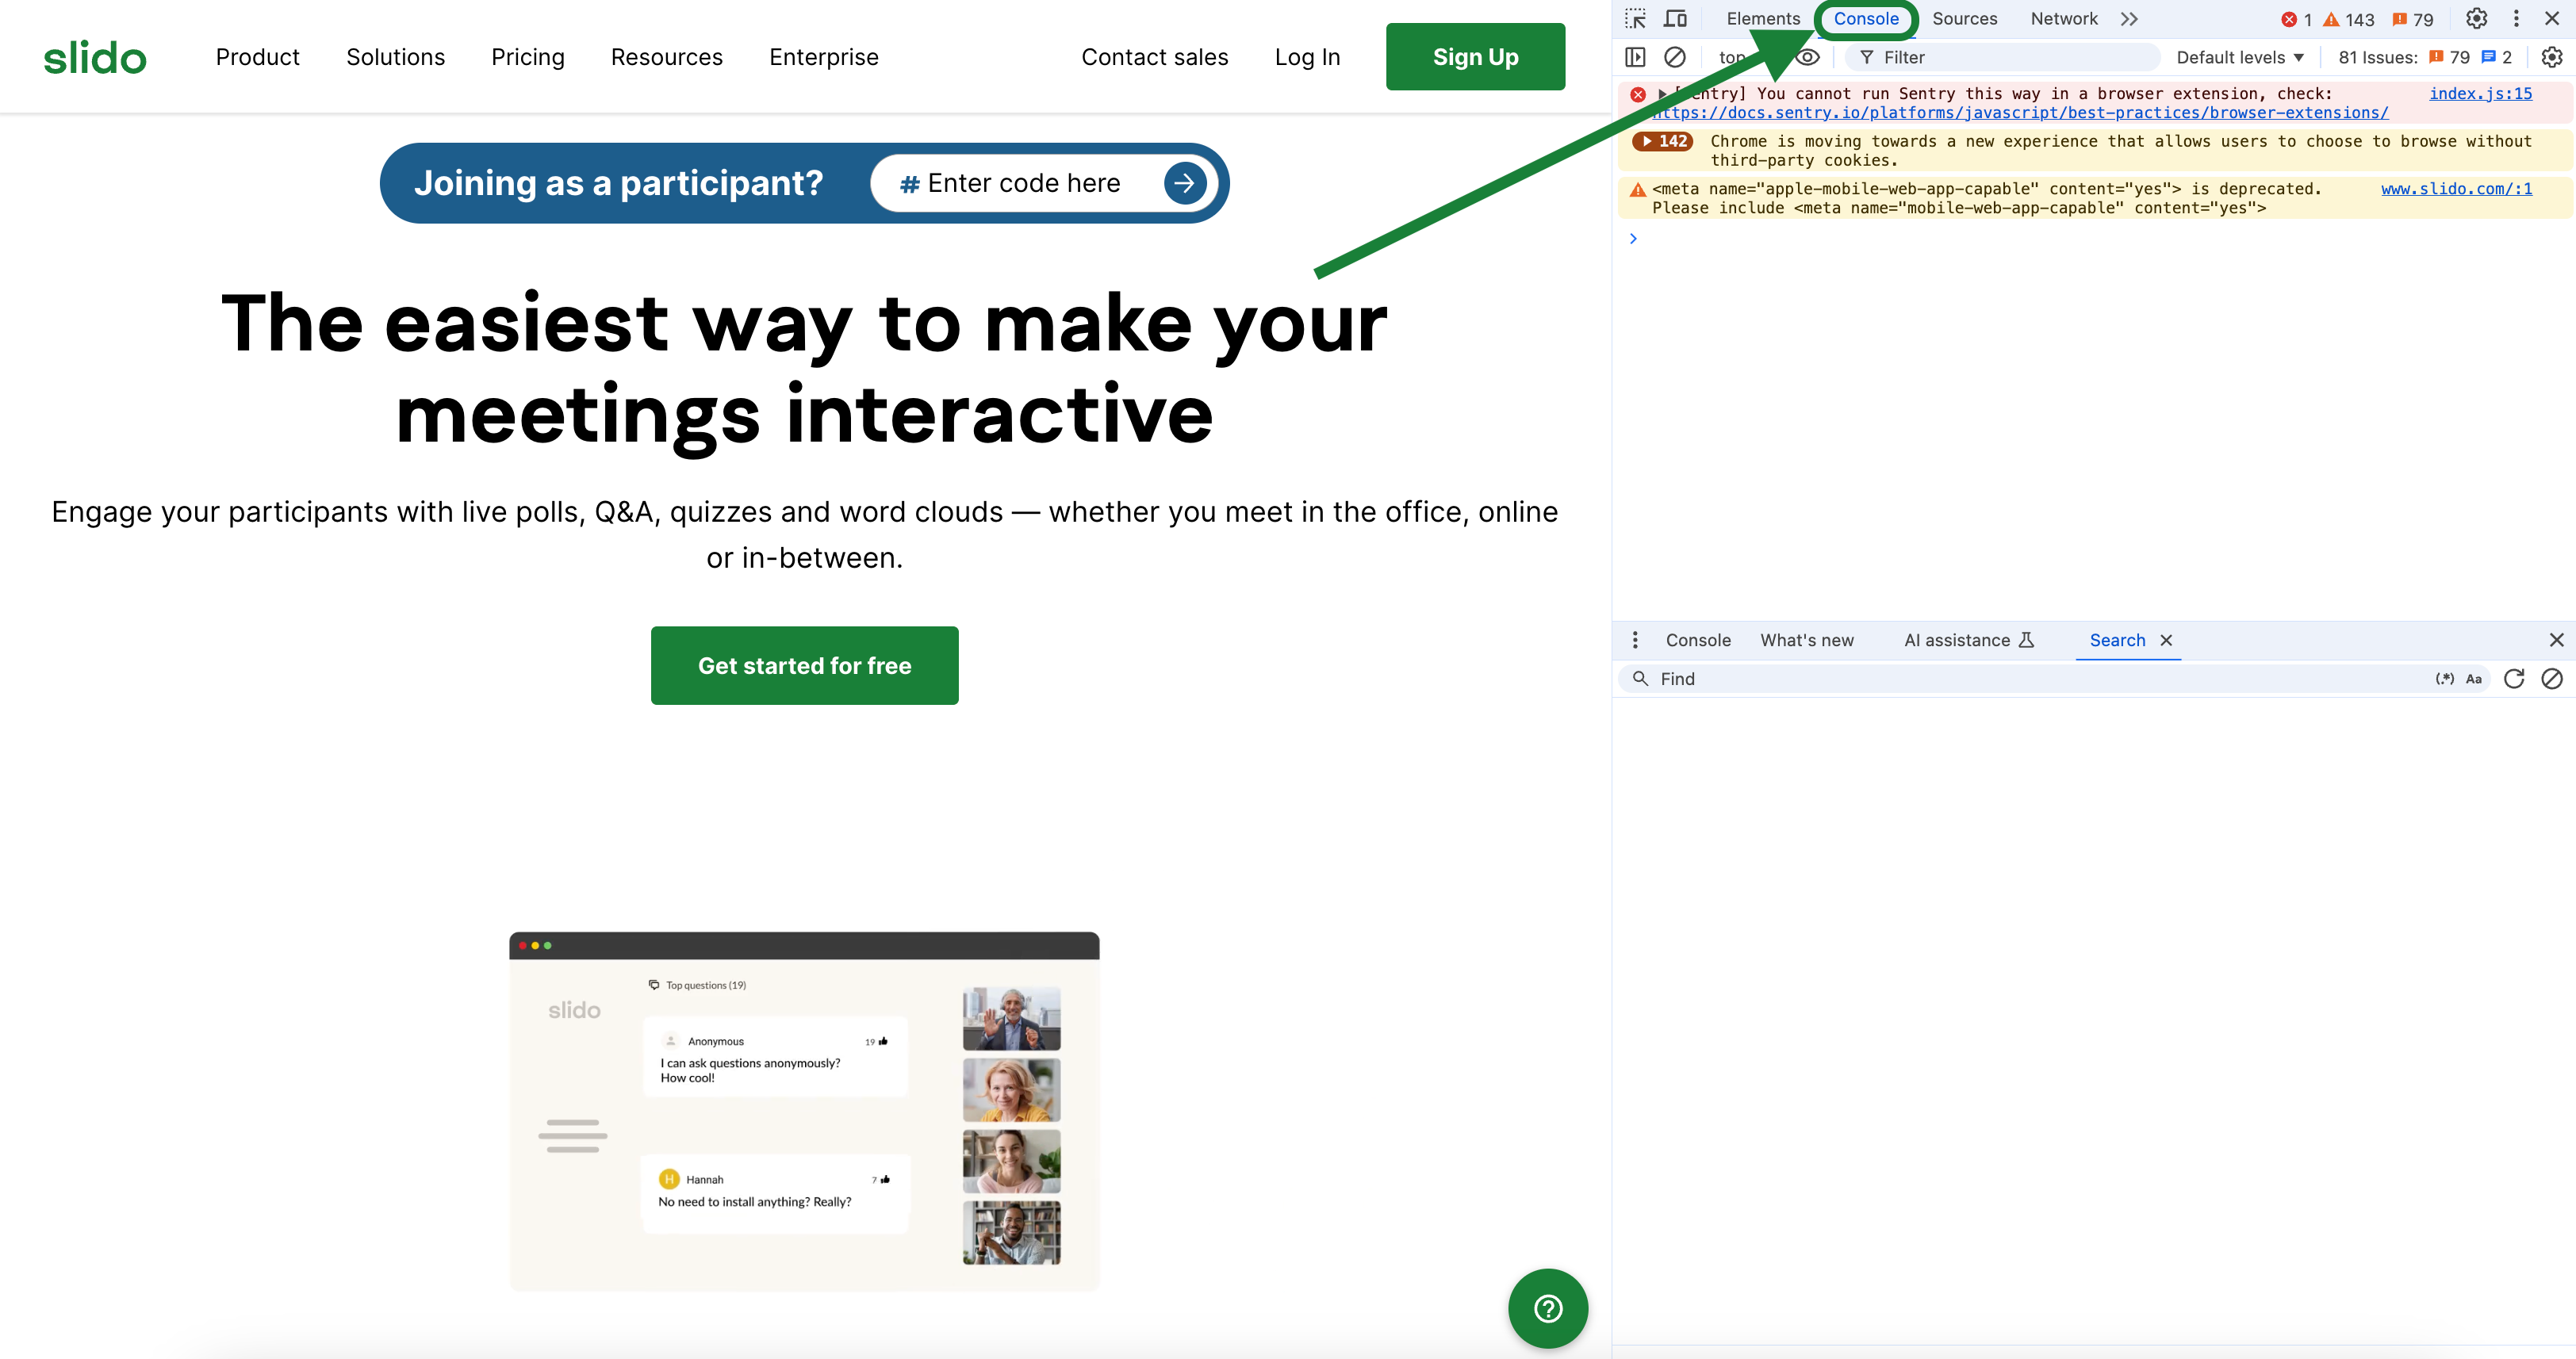
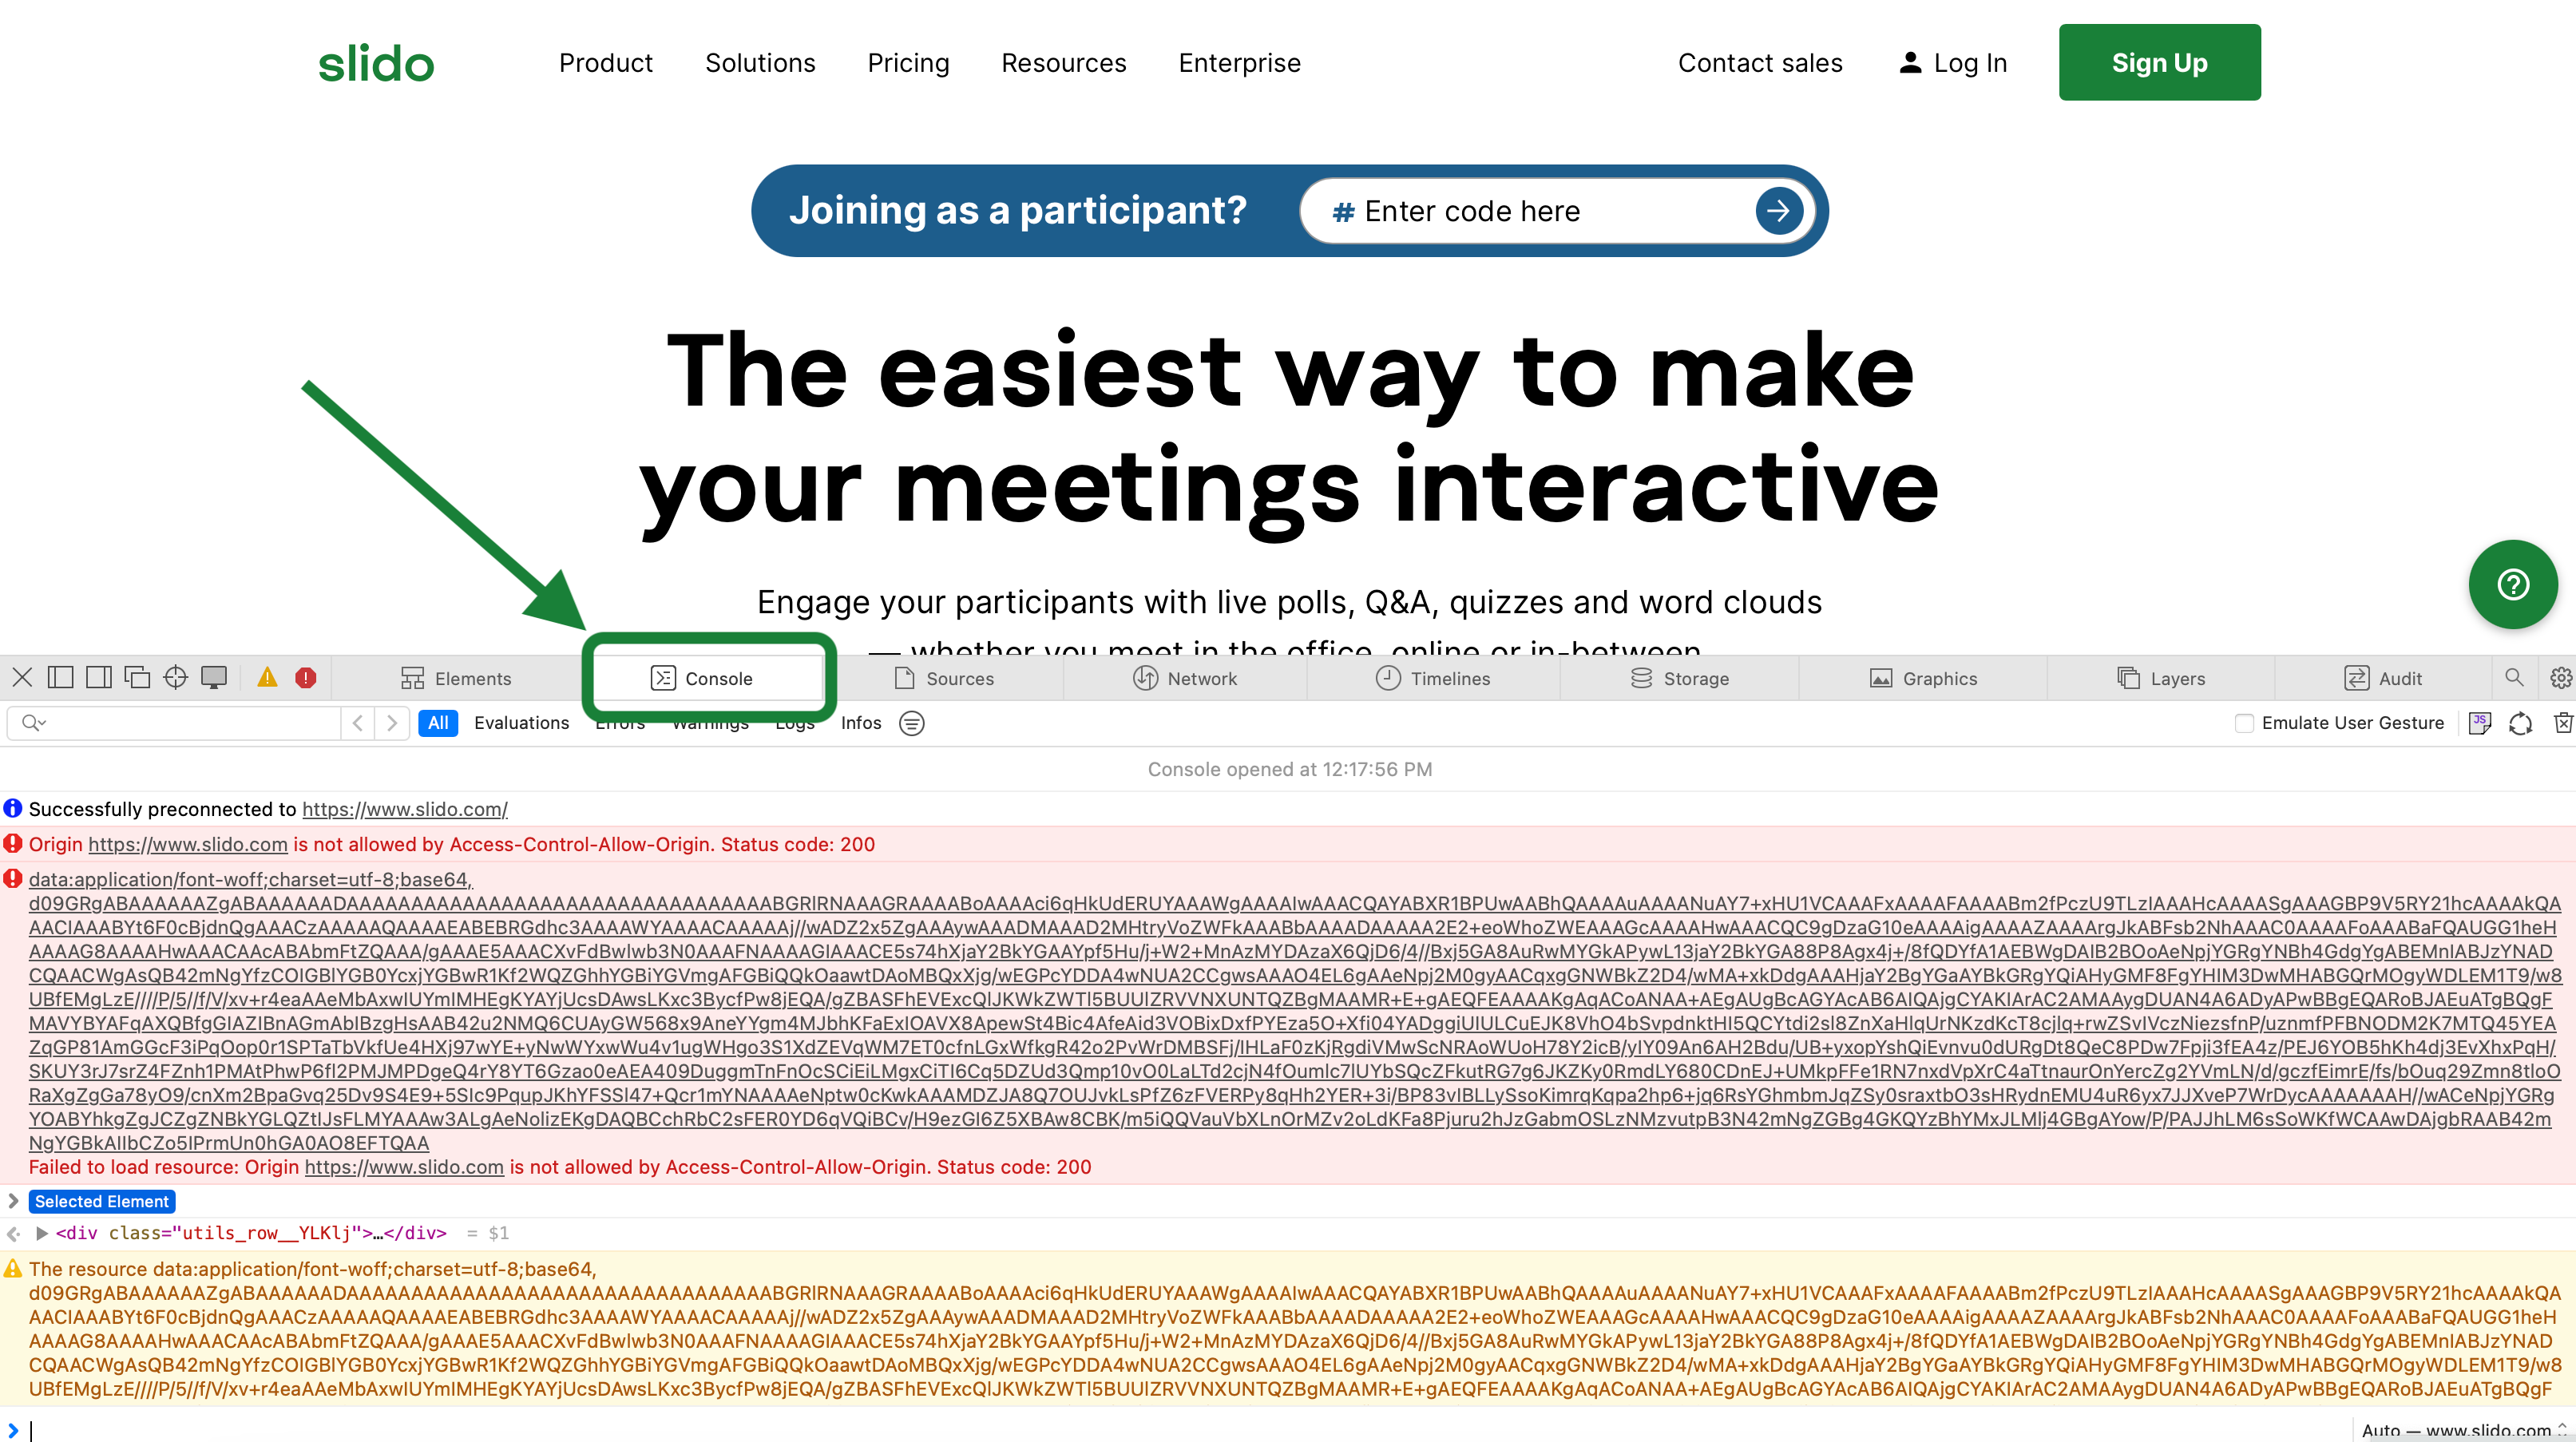
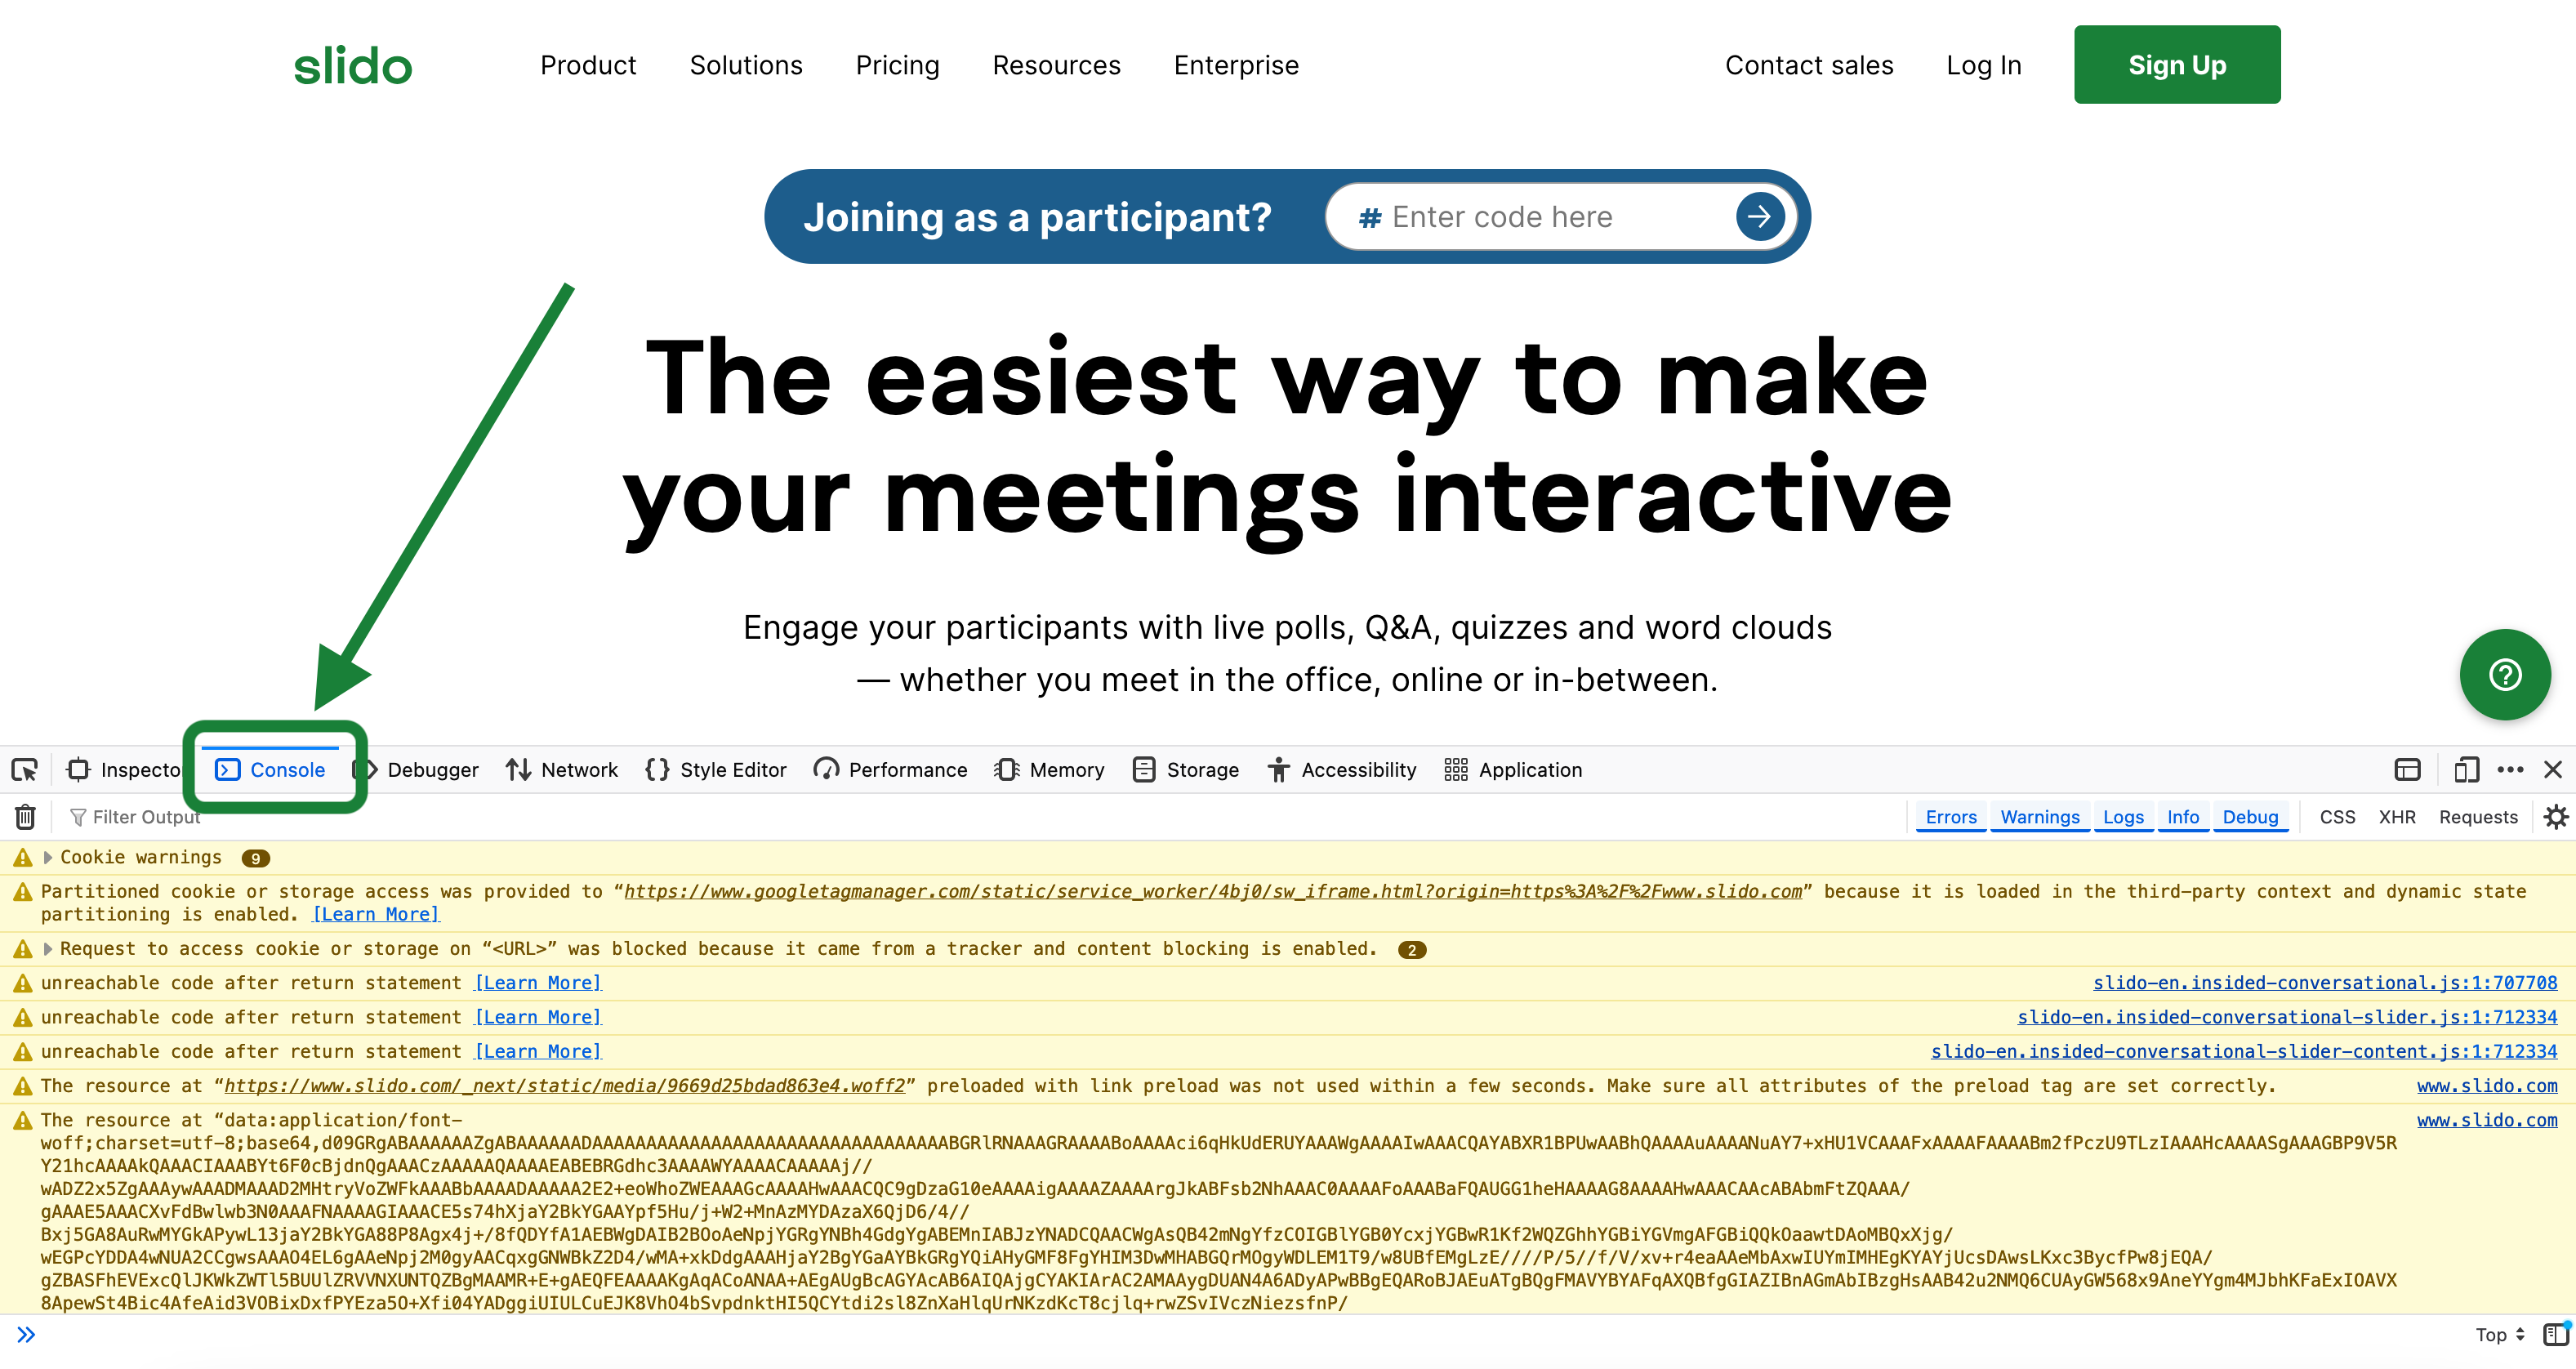
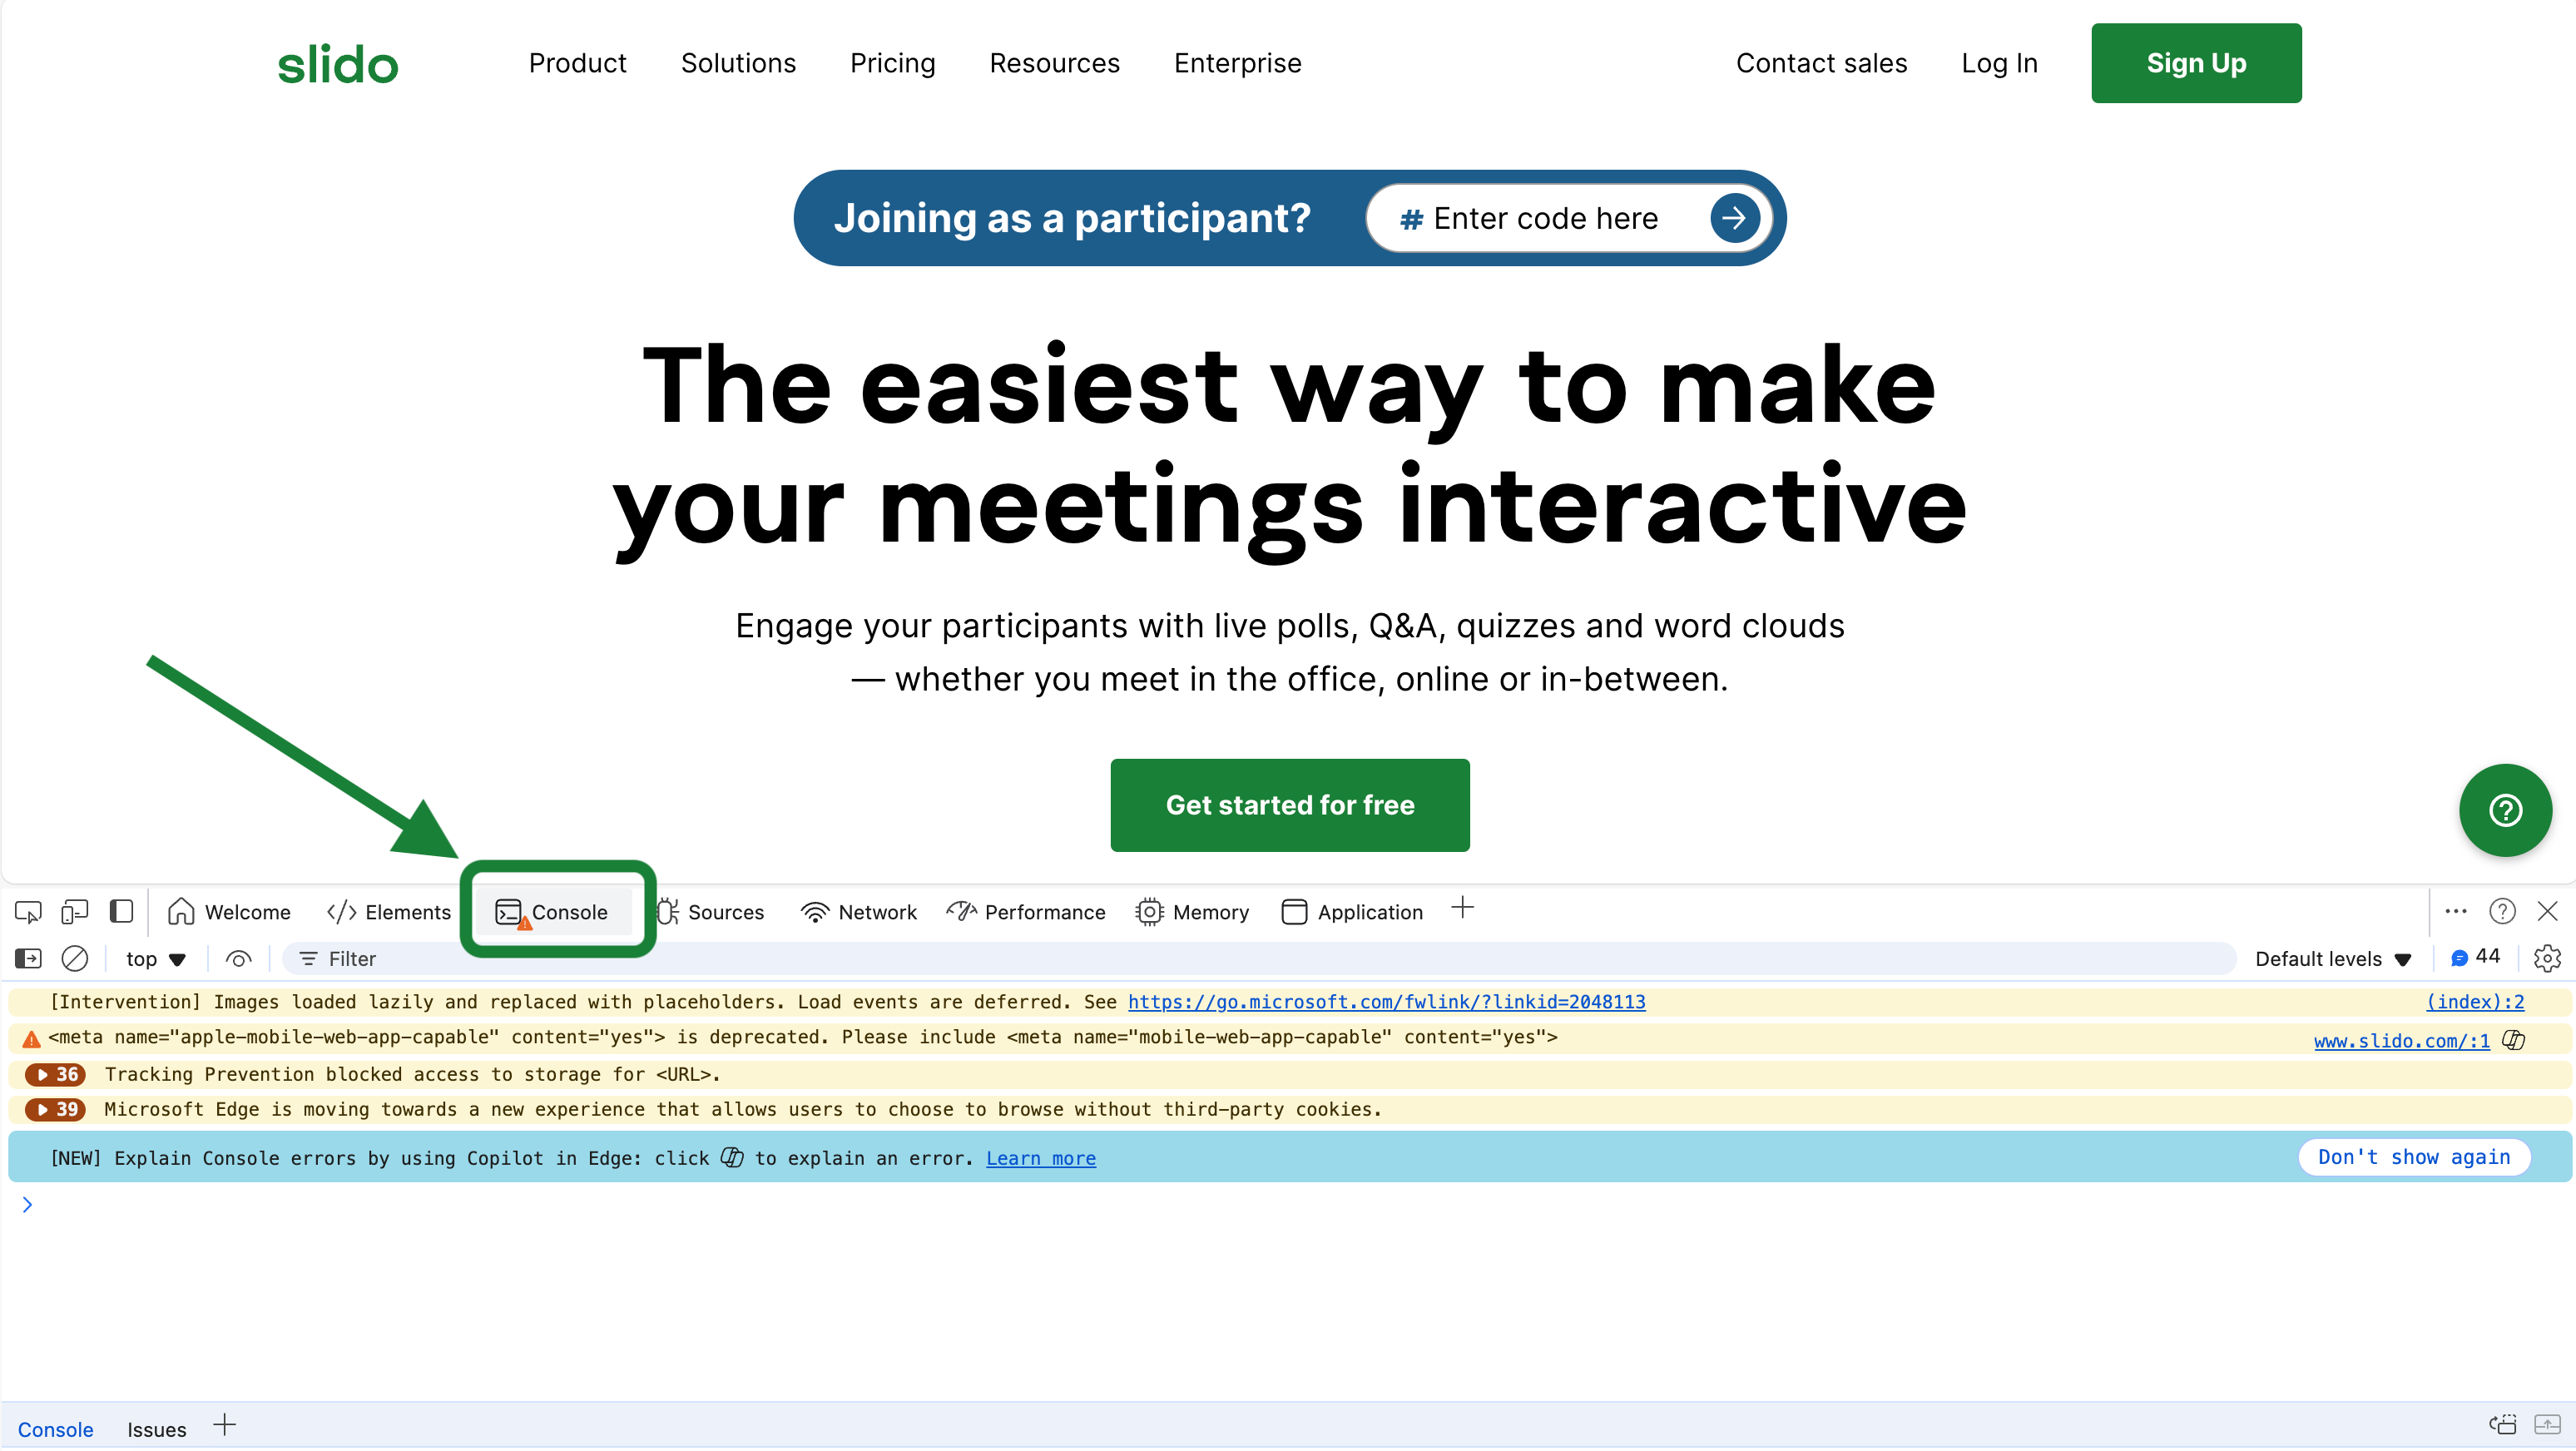
- Click on Console tab in the window that appears
- Reload the page
- Look for errors and unwrap them
- Take a screenshot of the errors with PrtSc key on Windows or Cmd+Shift+3 on Mac and send it to our support team at support@slido.com.
Although the steps are similar for all browsers, the view might be slightly different. See some common browsers below and where you can find their specific Console tab:
Don’t forget to first right-click and select either Inspect or Inspect element:
Chrome
Safari
Mozilla Firefox
Microsoft Edge
Curious to learn more?
