

As a license owner or admin, you can use Organization Analytics to get an overview of the data collected from all of your slidos. You can view and download statistics about engagement, the most popular topics, the most active slidos, and much more.
And if you have any additional members on your license, you can monitor their usage and manage their access based on how they’re using Slido.
In this article:
Access your Organization Analytics dashboard
To access your Organization Analytics, log in to your account and select the Analytics tab on the left.
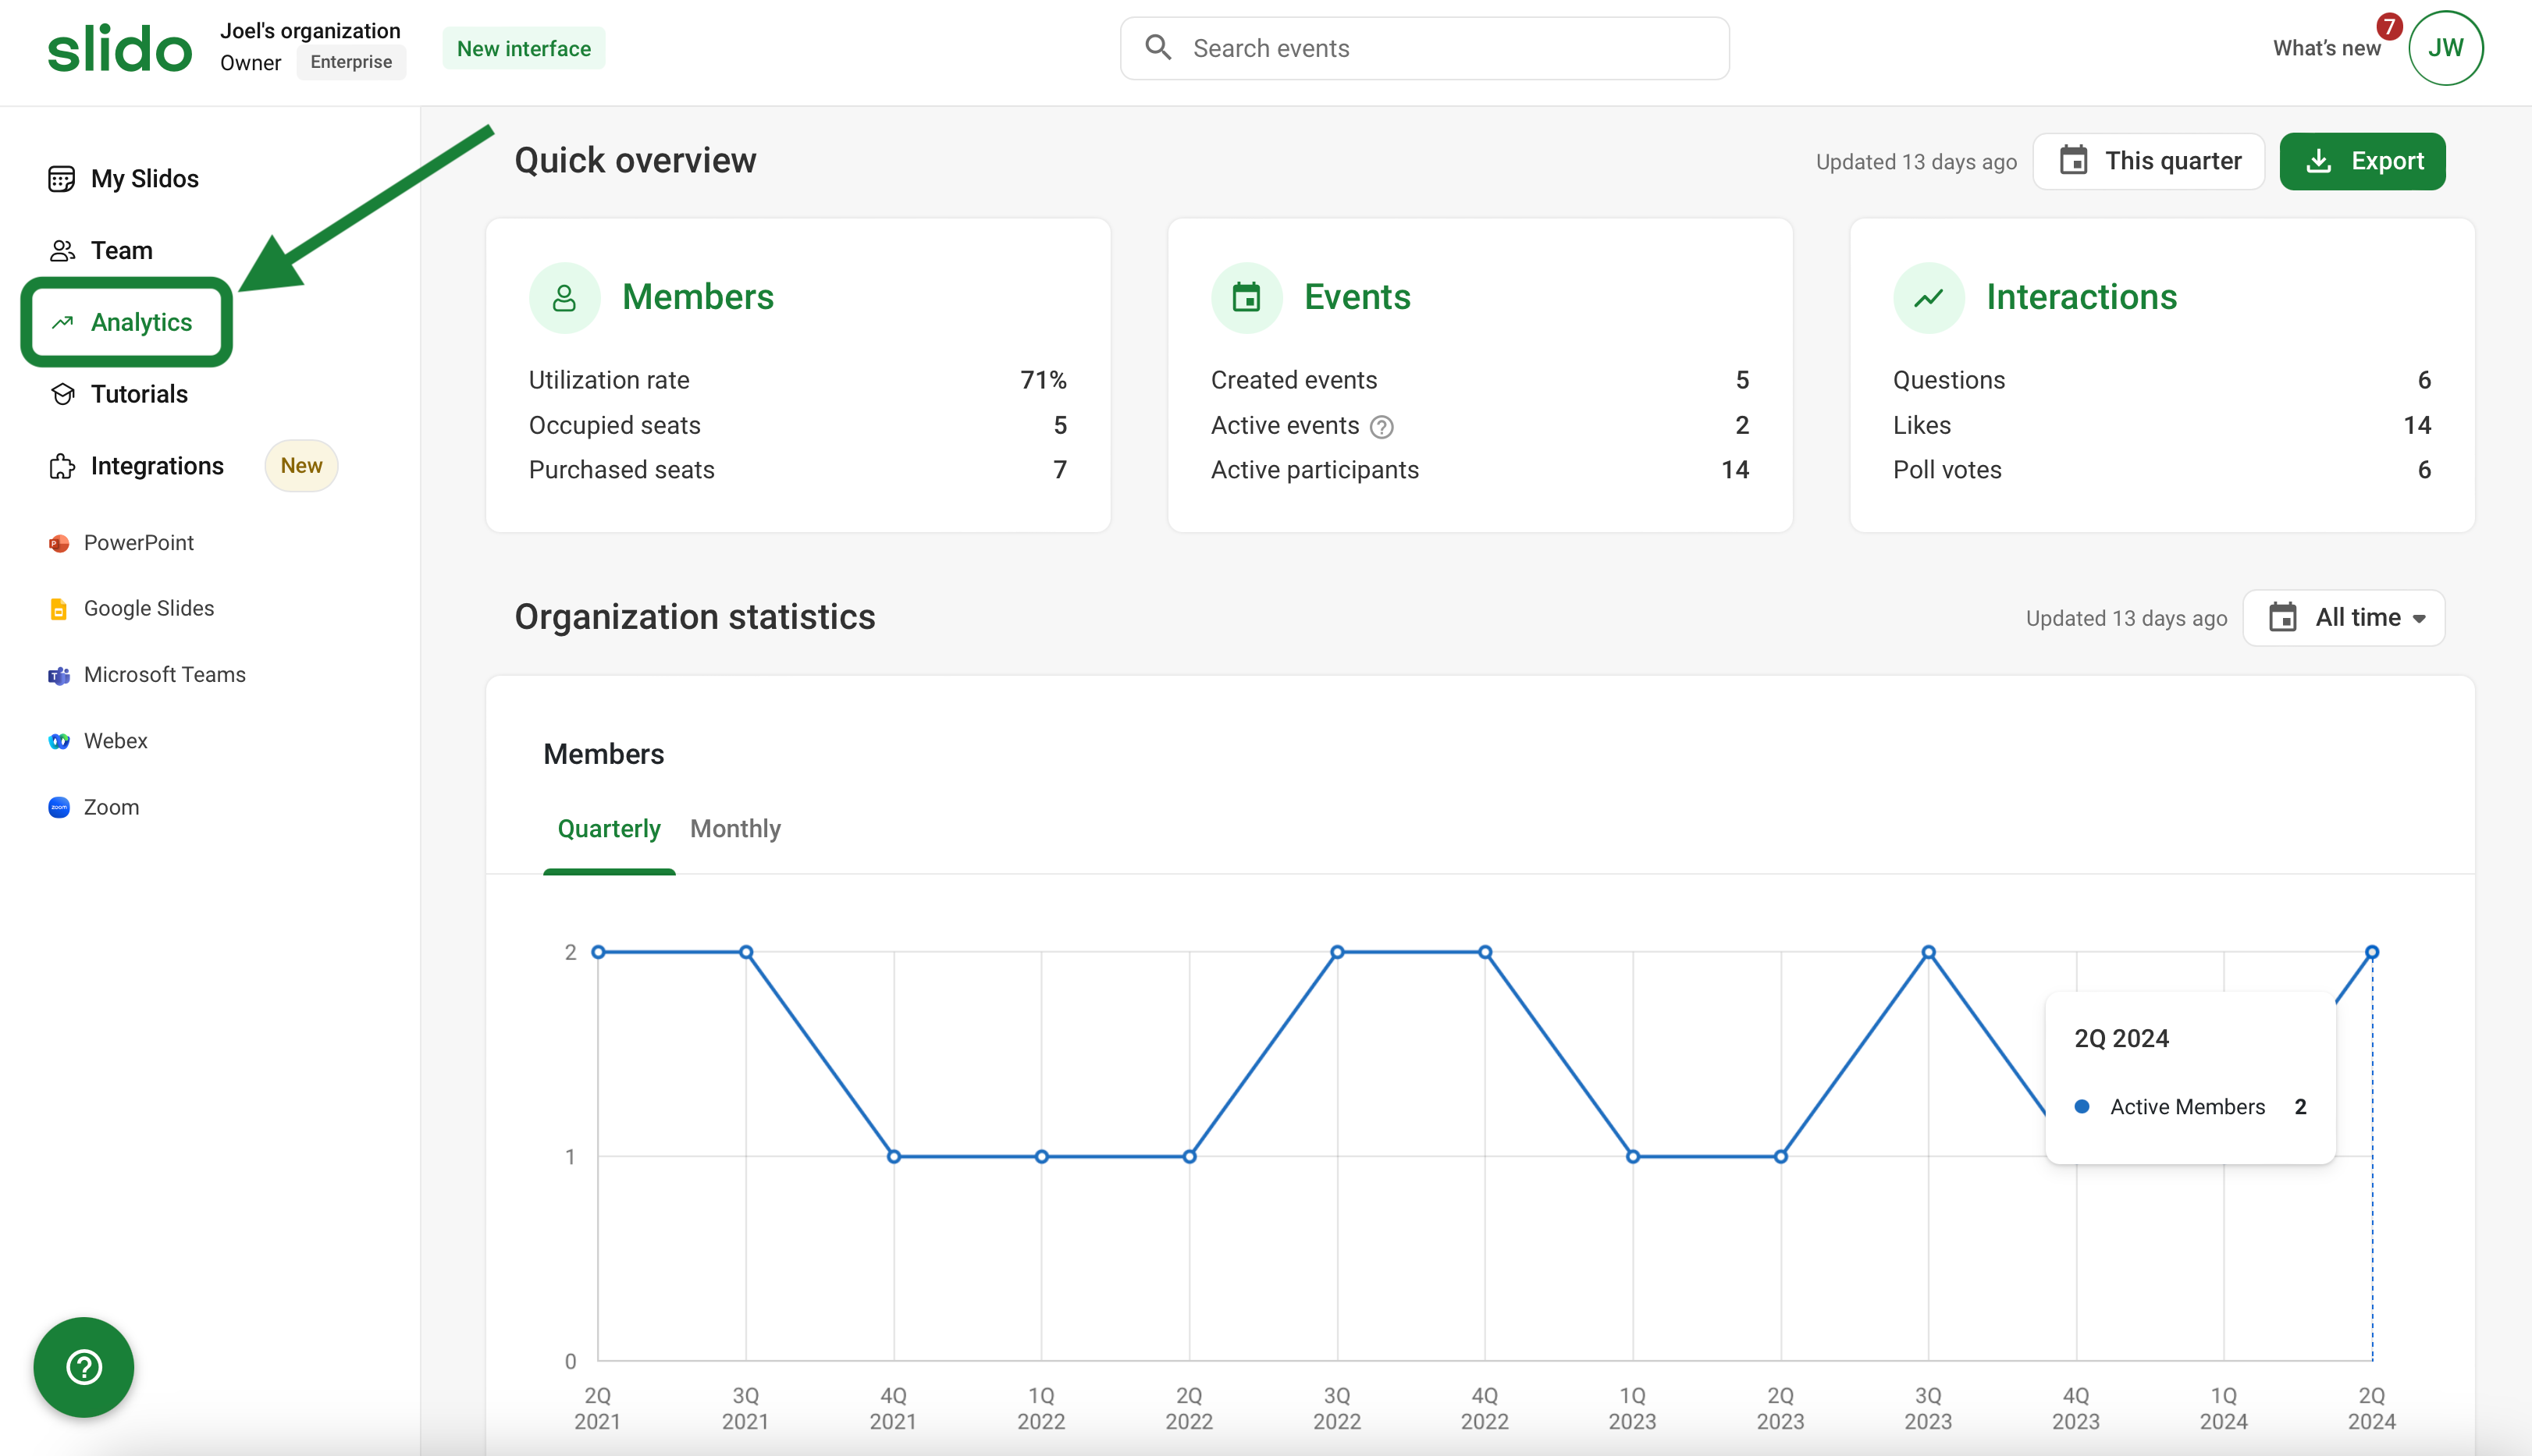
If you have more than one member seat under your annual license, you'll see their usage statistics too.
Analytics for licenses with additional members
With additional members in your organization, Organization Analytics gives you a dashboard to monitor the overall usage of your license. This is especially helpful for the evaluation of members' activity and how they’re using Slido.
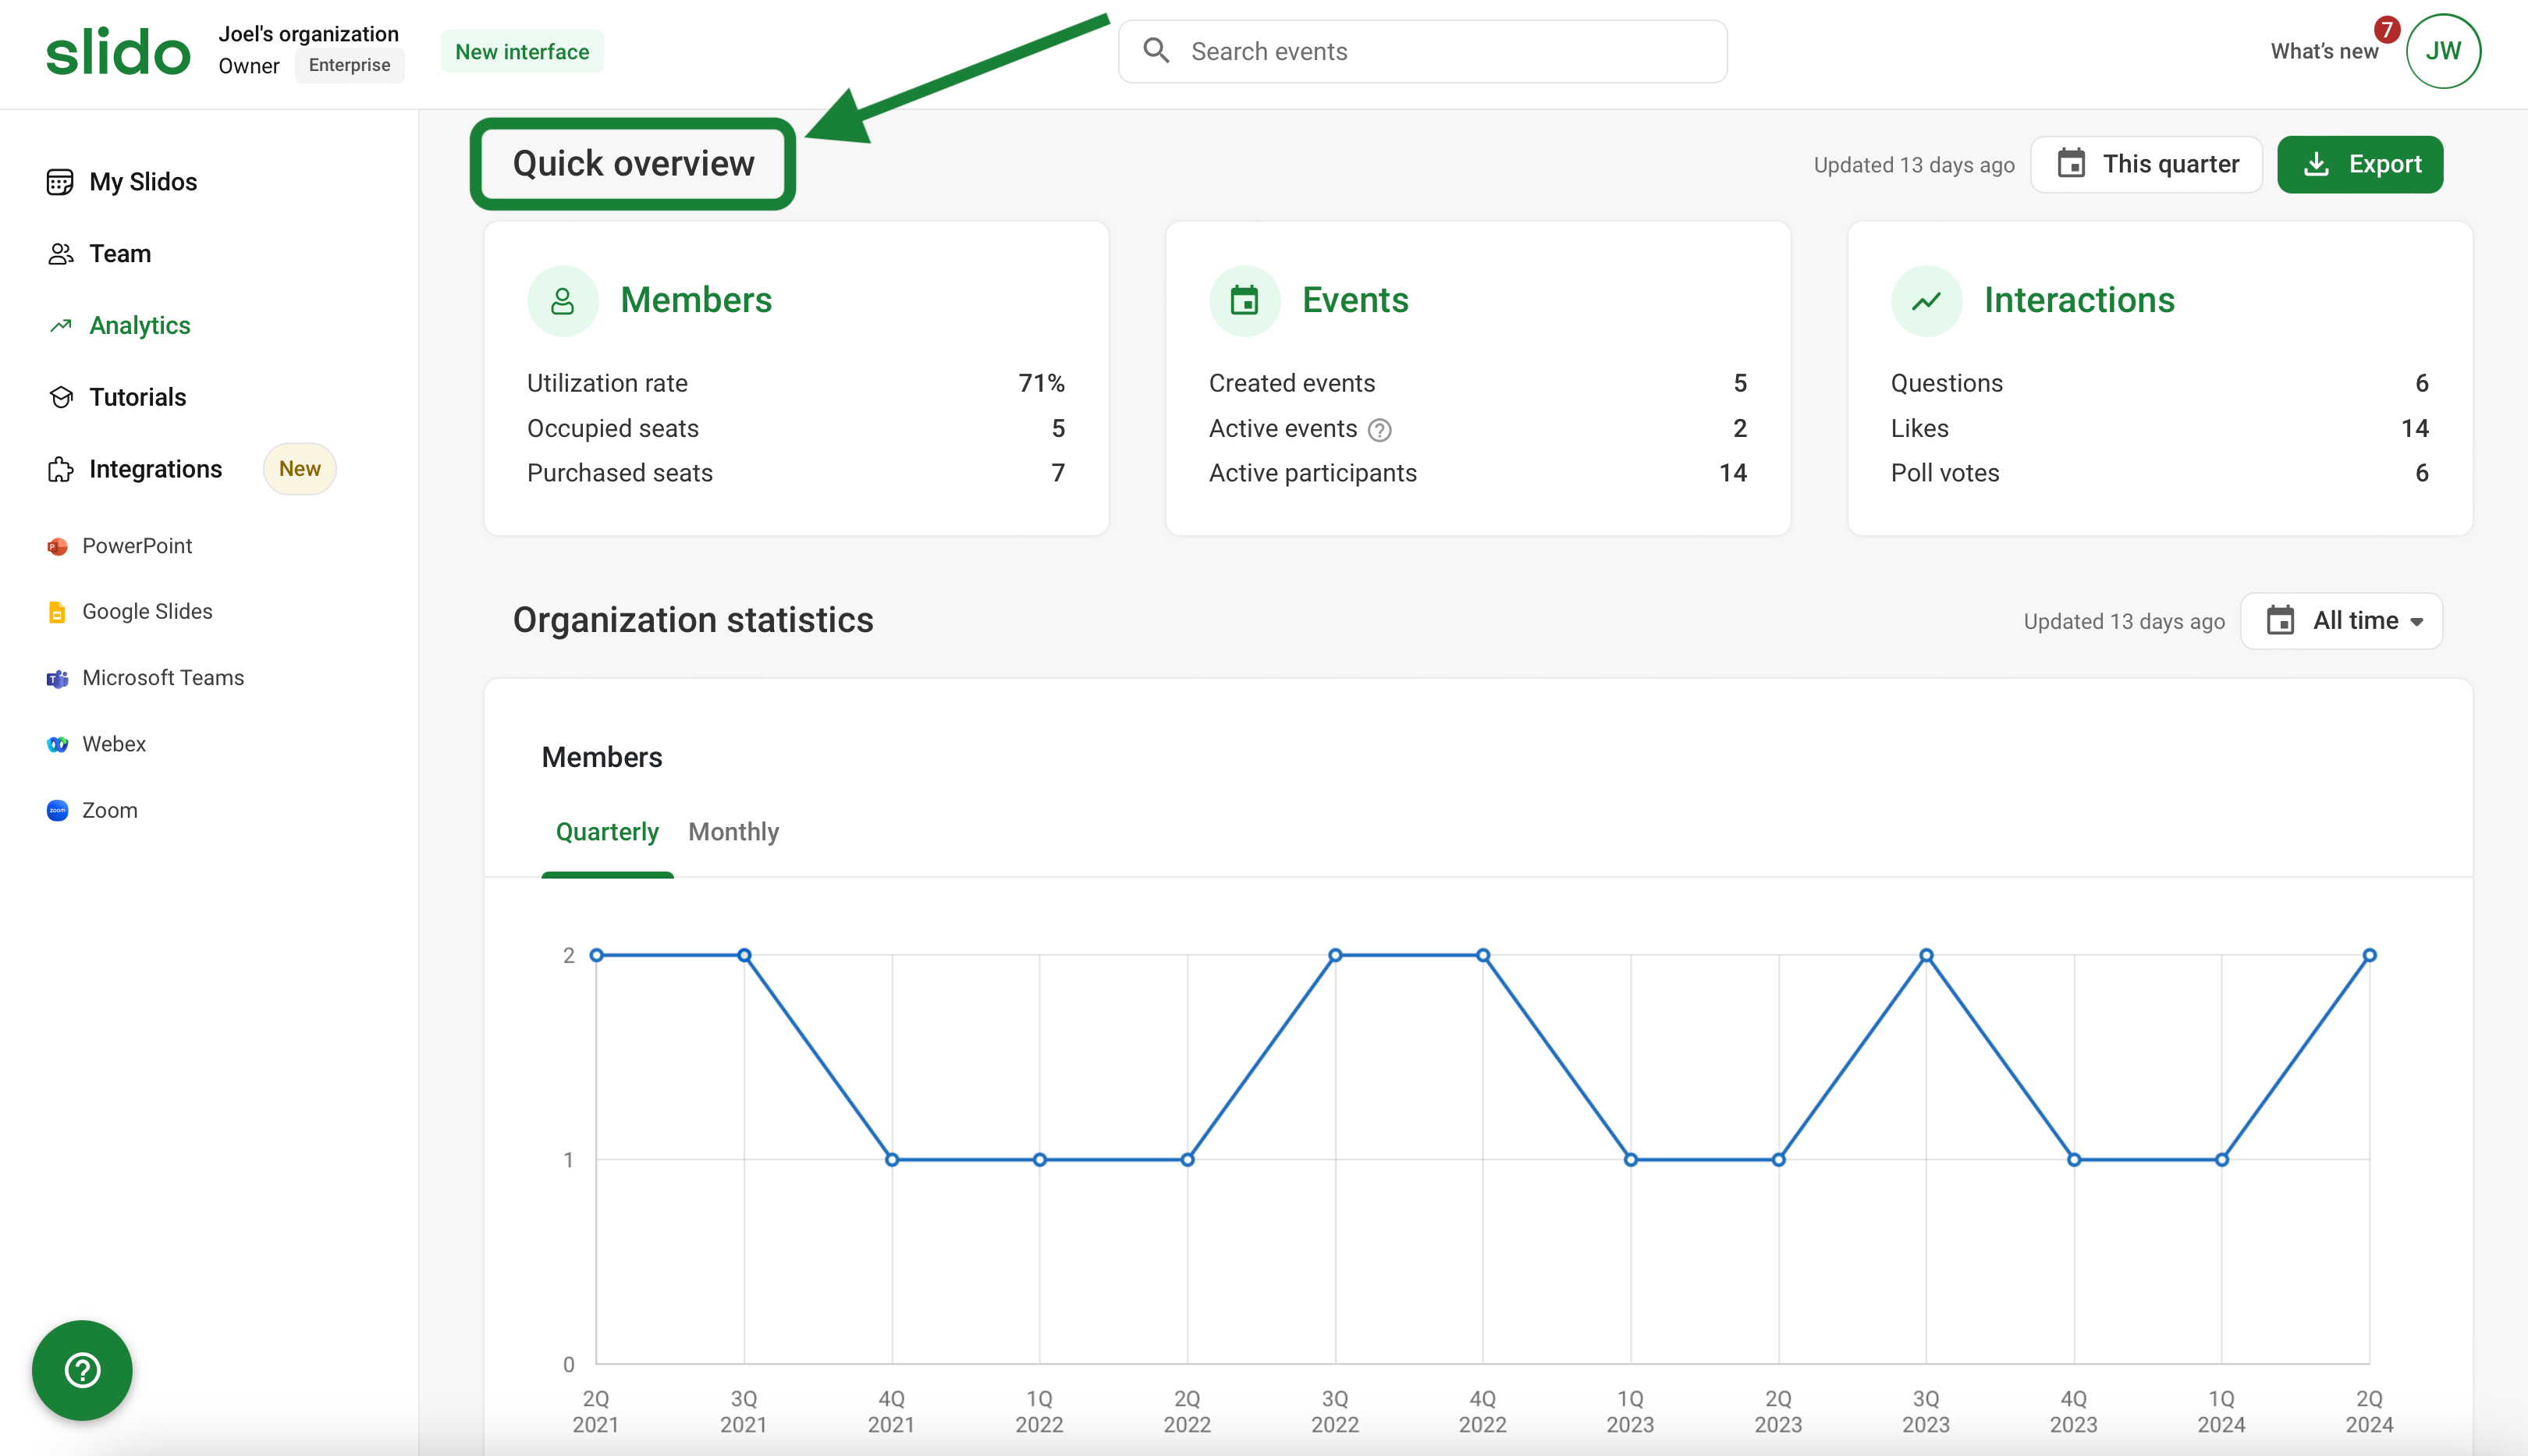
Quick overview
In this section, get a brief glimpse of your available member seats, your slido numbers (including active participants), and your interaction stats.
Organization statistics
This section consists of five charts, allowing you to see how many of your members actively use Slido, what features they use, and how much they use them. All of the charts have a quarterly and monthly view, and can be displayed either for the last 12 months or all-time periods.
What does each chart represent?
- Members: Track the number of active members in your license and its usage limit
- Team management details: Track the number of invited, joined, deactivated and removed members in your license
- Slidos: Track the number of created and active slidos
- Participants: Track the number of joined and active participants
- Features usage: Track the overall numbers of asked questions, question upvotes, and poll votes
Analytics for licenses without additional members
You can use Organization Analytics to track various engagement metrics ranging from popular questions to the total number of votes.
To access this data, you will need to select the time range first. Then you will be able to:
- See a word cloud of the most popular questions and topics discussed in your slidos
- Easily track the number of active slidos, the number of created slidos, and the engagement scores
- Compare the interactions of your most active slidos
- See the total number of poll votes
Export your results
You can also export summary reports of questions and polls for further analysis.
Available in any paid annual plan
- Click the green Export button
- Select the Download export or Export to Google option
- Choose your date range and click the category you’d like to export
This allows you to easily download and share the data with your stakeholders and/or clients.
The above example is from a license with additional members. If you do not have any, you won’t have the Quick overview or Organization statistics export options.
Curious about more?
