
Analytics provide an easy way to view and understand the data from your slido. You can use them to track participant engagement, discover popular topics, and much more – all in real time.
Use your Analytics to learn what resonates with your audience, create data reports, and even compare your own slidos to one another.
You can also export your data with any paid Slido plan
In this article:
Access a slido’s Analytics
To view a specific slido’s data, select the Analytics tab on the left side of the slido.
If you’re using Multiple rooms, you can choose to view the Analytics for the entire slido or filter by a specific room.
Understand your Analytics
At the top of your Analytics tab, you’ll see a general overview covering Engaged participants, Q&A engagement, and Poll engagement.
Engaged participants
This section of your dashboard shows the level of participant engagement overall.
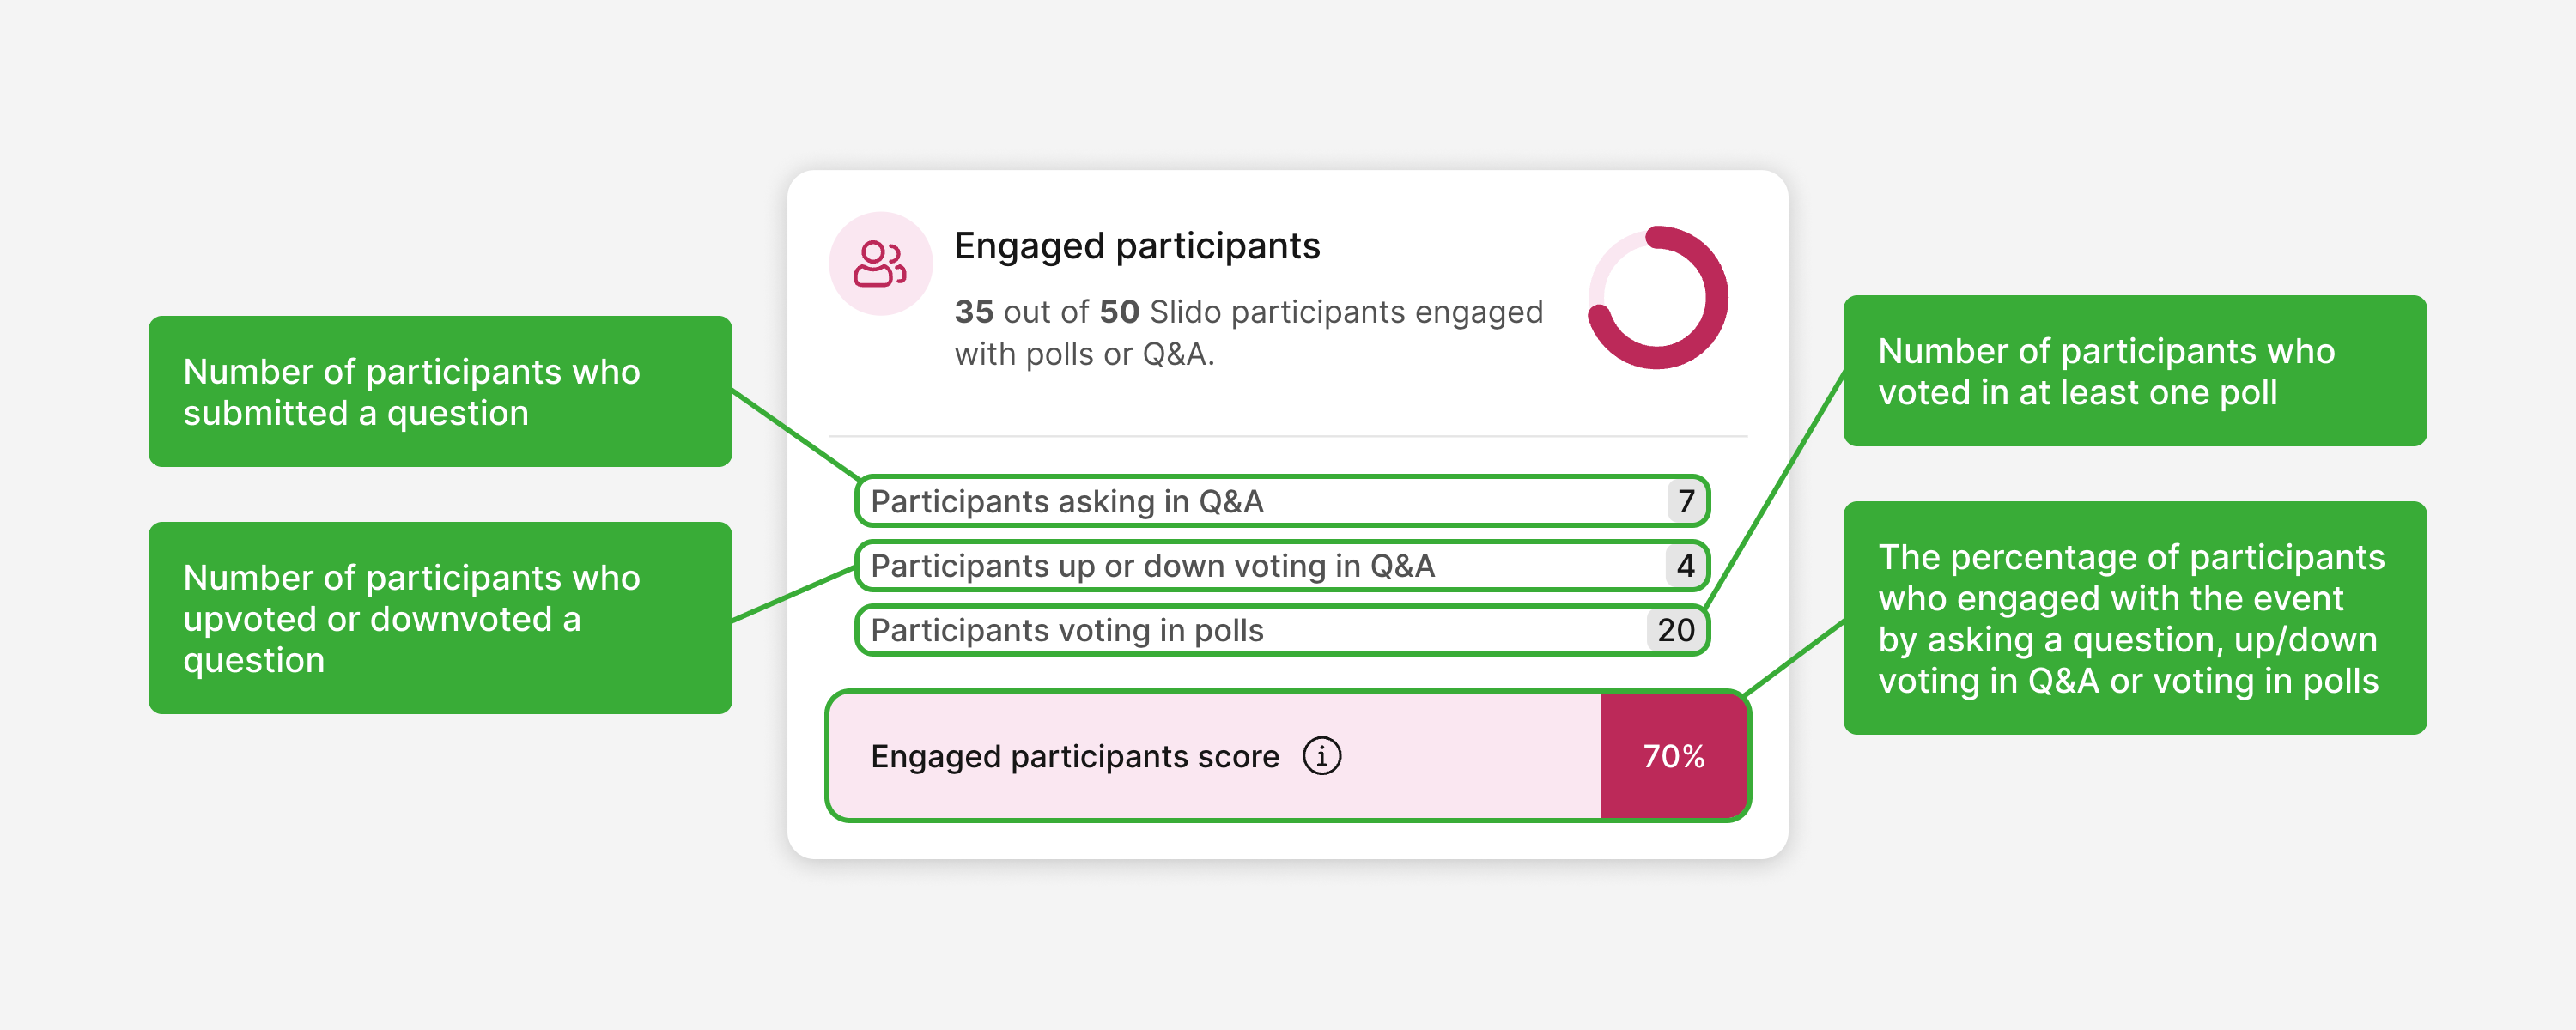
In this example, 7 participants submitted a question, 4 participants upvoted or downvoted a question, 20 participants voted in at least one poll, and 70% of all joined participants engaged with Slido in some way.
Q&A engagement
This section of your dashboard shows how participants interacted with the Q&A.
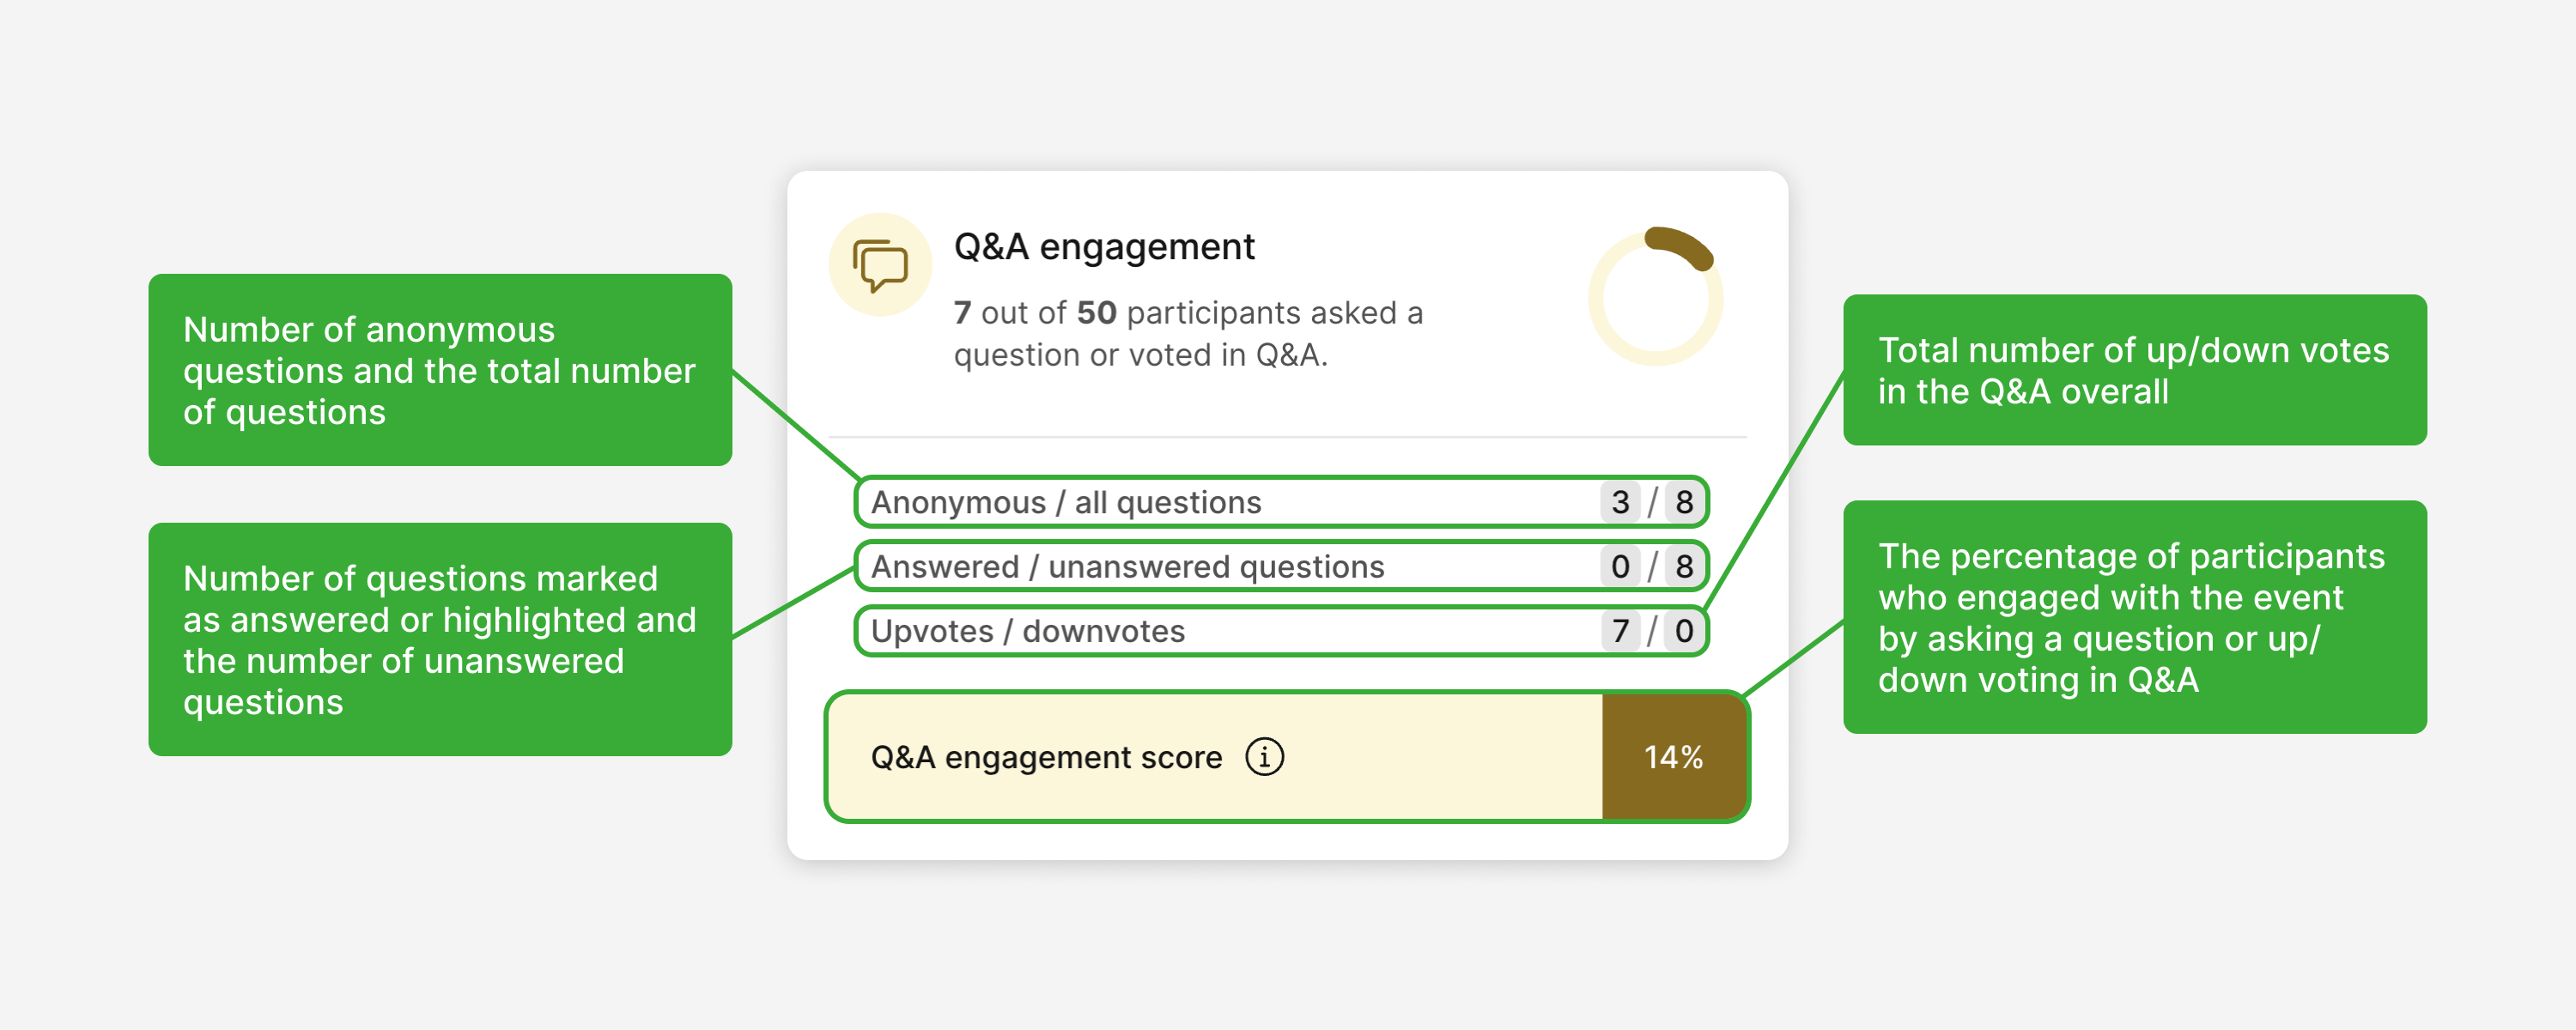
In this example, there were 3 anonymous questions and 8 questions in total. There were 0 questions marked as highlighted or answered. There was a total number of 7 upvotes and 0 downvotes. And out of all participants, only 14% engaged with the Q&A.
Poll engagement
This section of your dashboard shows how participants interacted with your polls.
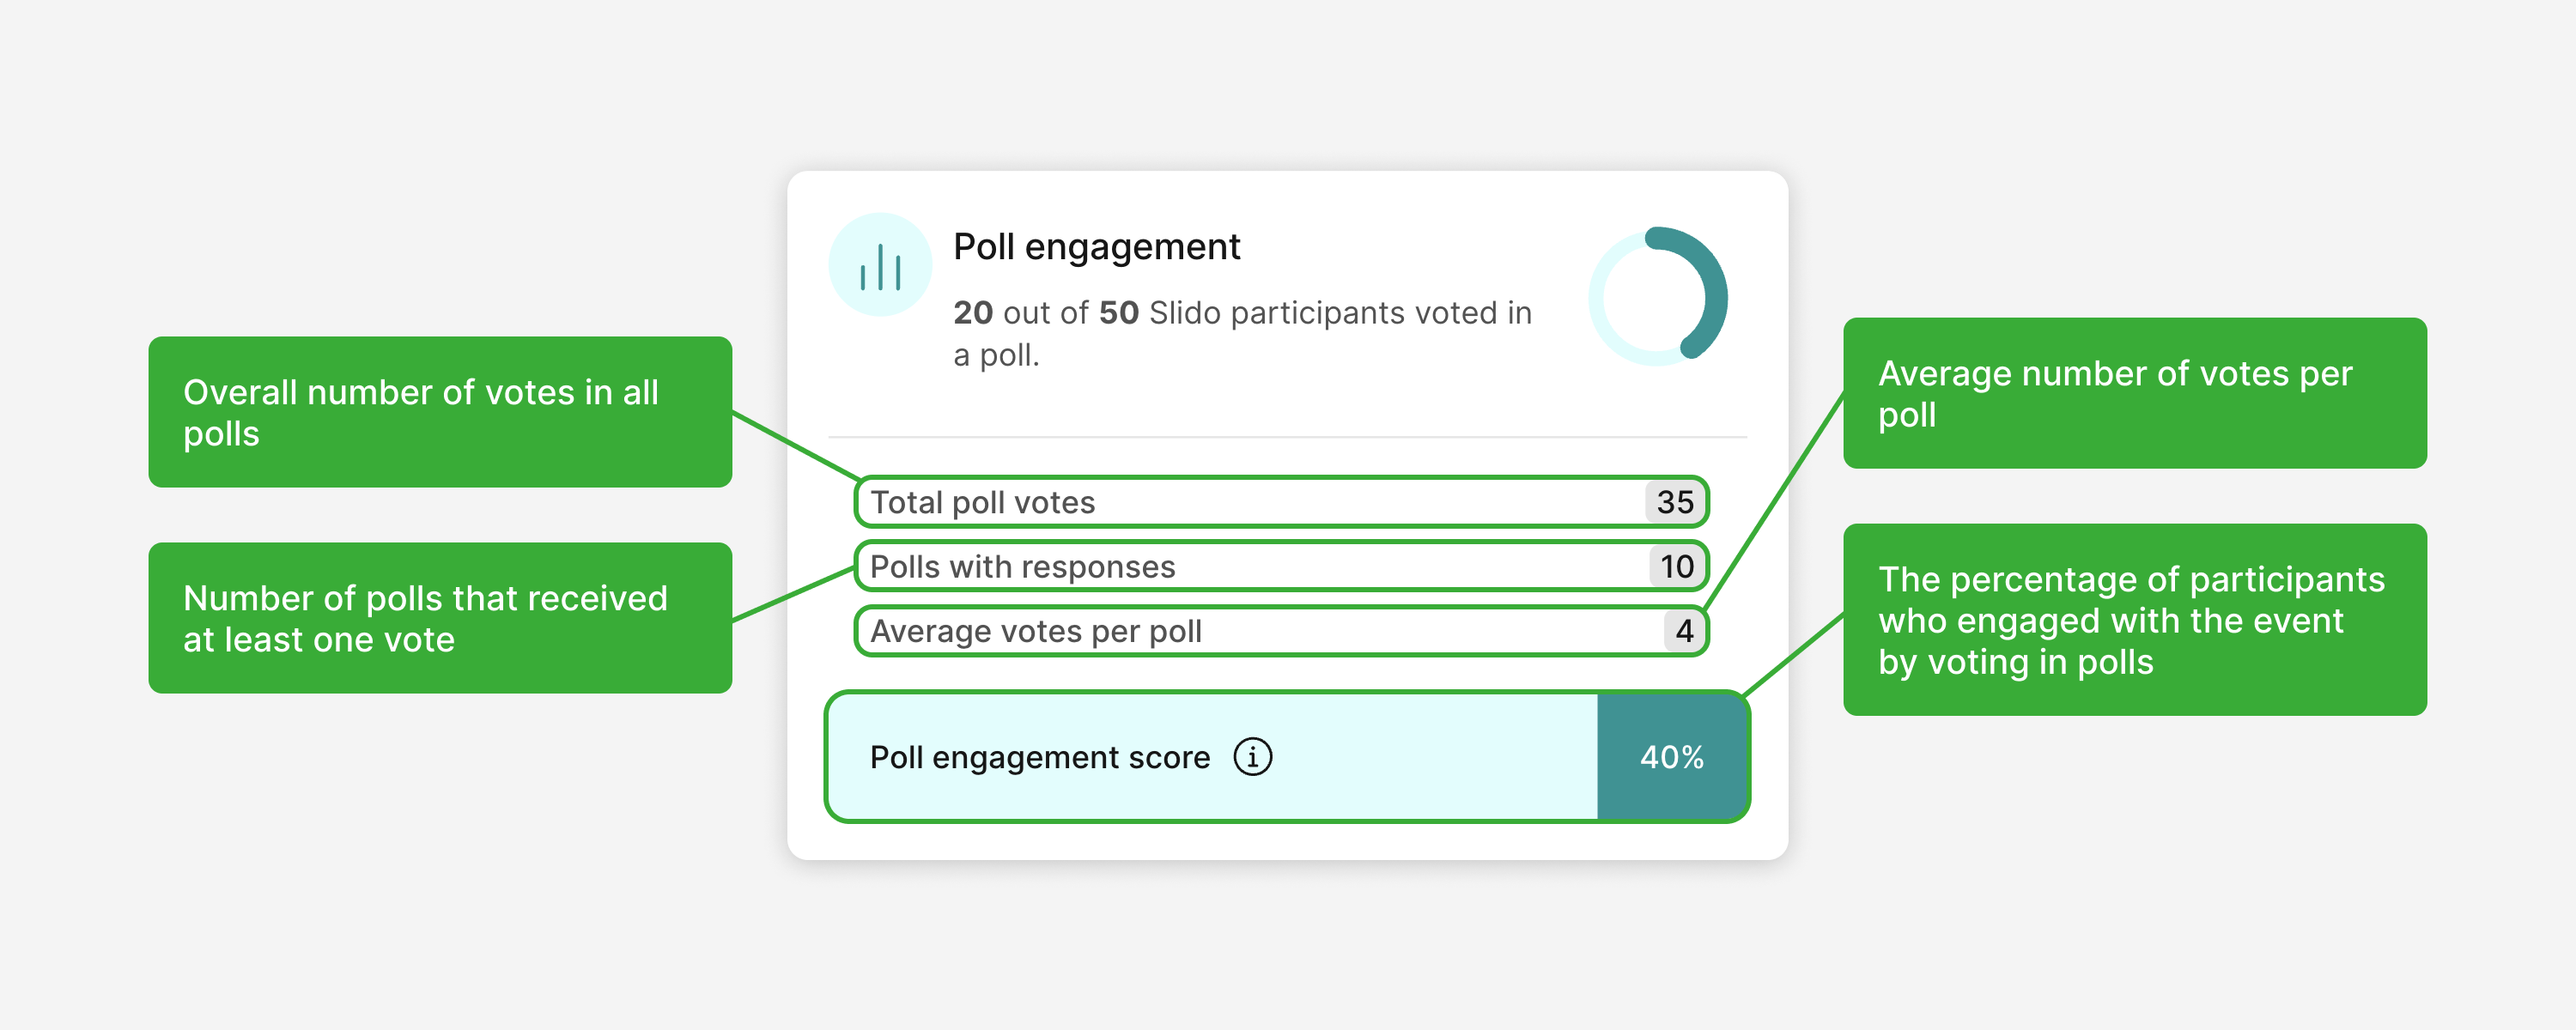
In this example, 40% of participants engaged with polls. There were 35 total poll votes in all, with 10 polls receiving at least one vote and 4 votes for each poll on average.
Q&A Insights
This part of the Analytics section shows the most upvoted questions and generates a word cloud of the most popular topics mentioned throughout your Q&A.
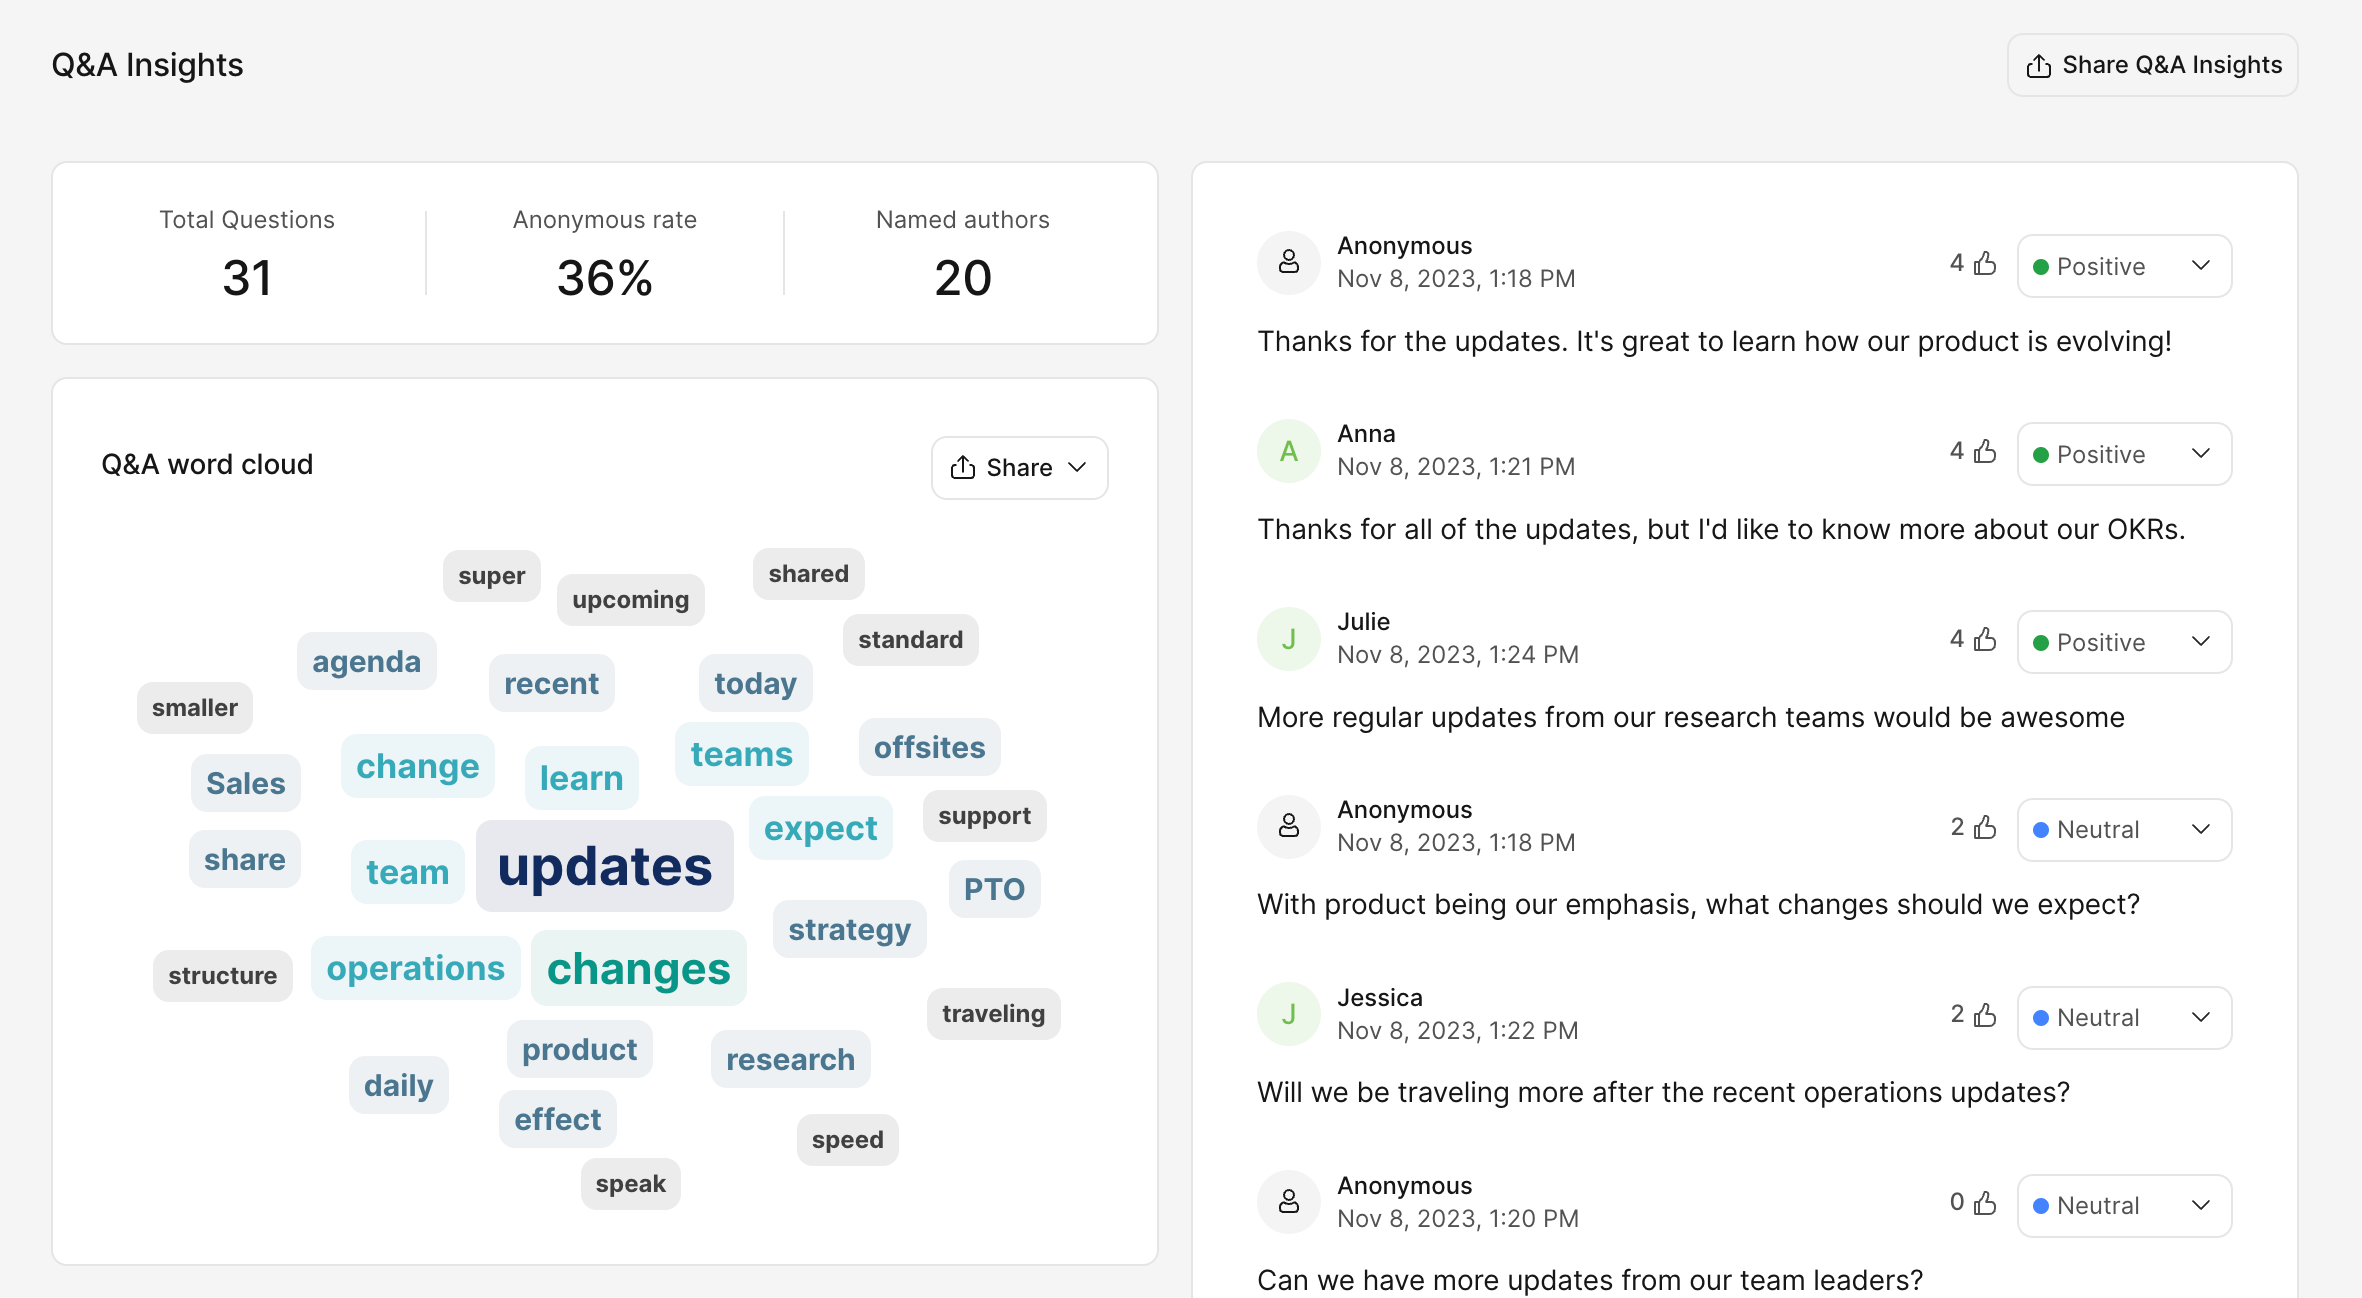
You’ll also see Question Sentiment analysis. This tells you what percentage of your Q&A questions were identified as positive, negative, or neutral.
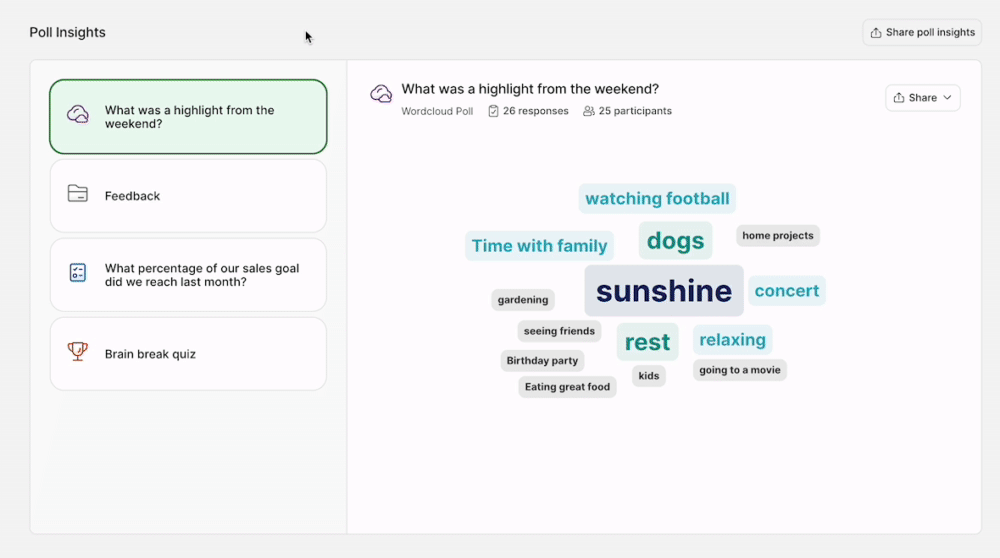
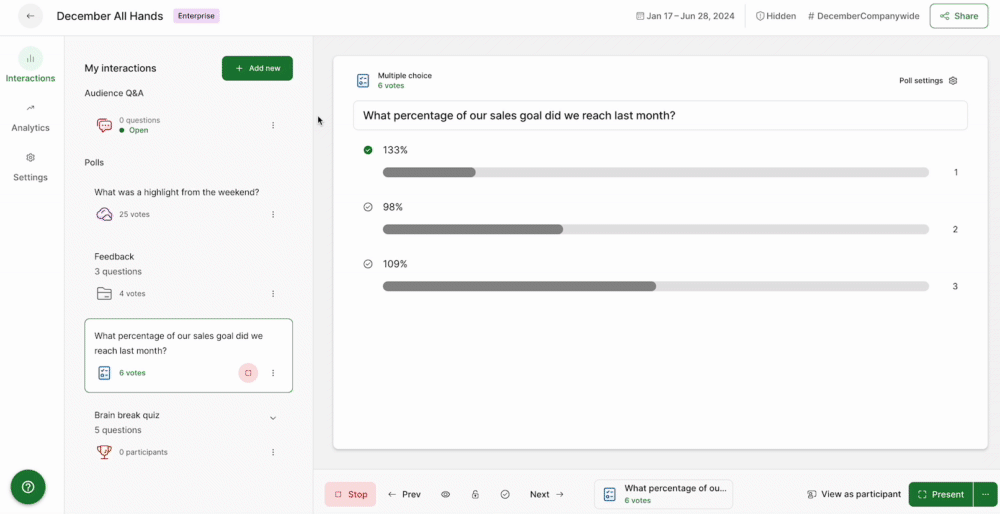
Poll Insights
This section allows you to quickly look through all of your poll results.
Share your Analytics
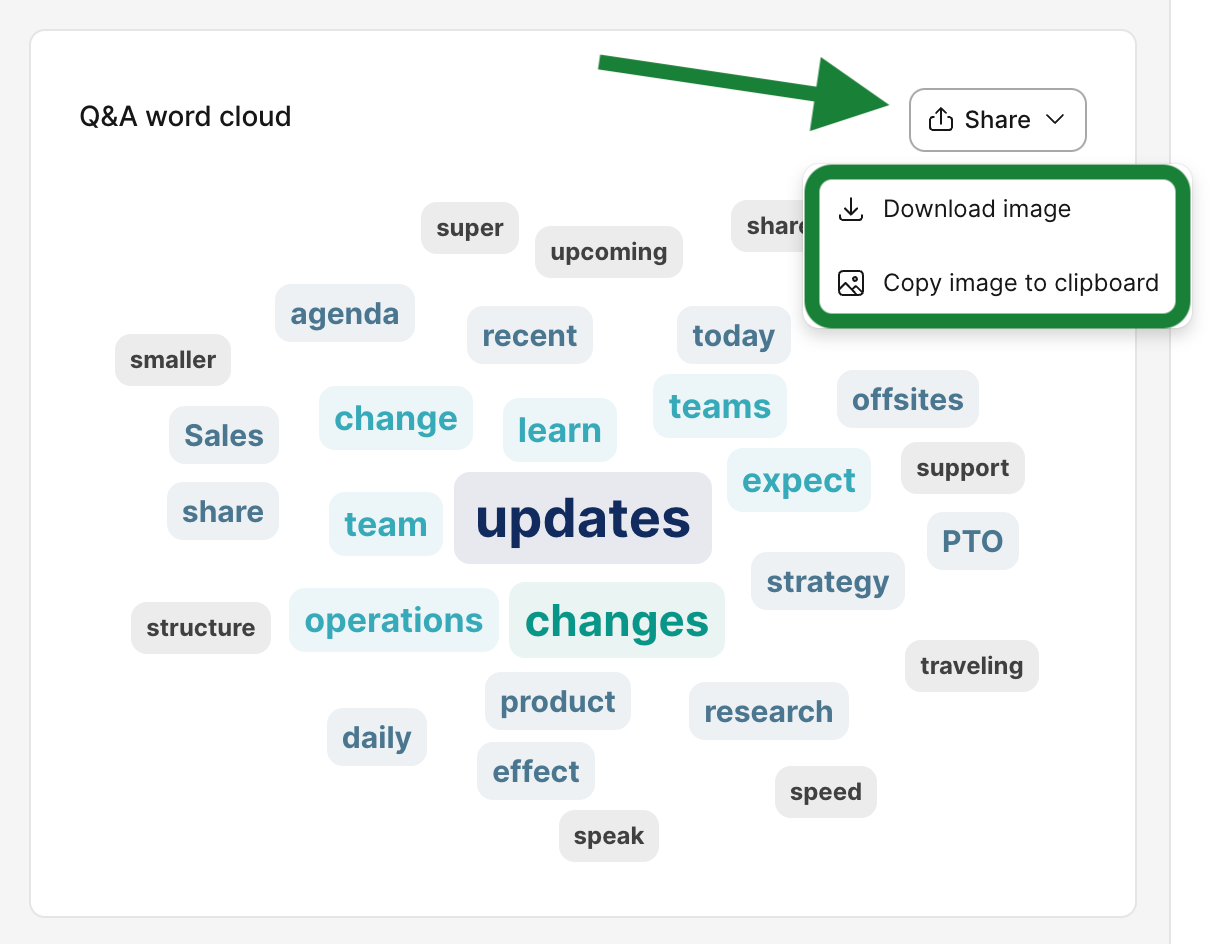
Not only can you download or copy the images from your Analytics, but you can even generate a link to share your Analytics with others.
Download or copy images
Any visual from your Analytics will have a Share option near the top right corner. There you can choose to download the image or copy it to your clipboard.
Share your Analytics with a link
If you’d like to send a link to your entire Analytics page (or even just specific sections of it), click on the Share Analytics option. This will open up a sidebar where you can choose what sections to include, decide how long the link should last, and create/copy the link itself.
Remember that you can also Export your Analytics with any paid plan.
Co-hosts will also have access to Analytics.
Learn more: